TUT 4 A on Ch 17 MEMO
Questions 1
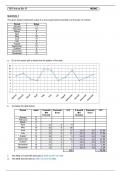
The given dataset represents sales at a local supermarket recorded over the past 12 months.
Period Sales
January 11
February 13
March 9
April 8
May 16
June 15
July 8
August 10
September 15
October 8
November 10
December 12
a. Do a time series plot to determine the pattern of the data
18
16
14
12
10
8
6
4
2
0
b. Complete the table below:
Period sales 3-month Forecast 𝑺𝑺𝑺𝑺𝑺𝑺 5-month Forecast 𝑺𝑺𝑺𝑺𝑺𝑺
MA Error MA Error
forecast forecast
January 11
February 13
March 9
April 8 11 -3 9
May 16 10 6 36
June 15 11 4 16 11.4 3.6 12.96
July 8 13 -5 25 12.2 -4.2 17.64
August 10 13 -3 9 11.2 -1.2 1.44
September 15 11 4 16 11.4 3.6 12.96
October 8 11 -3 9 12.8 -4.8 23.04
November 10 11 -1 1 11.2 -1.2 1.44
December 12 11 1 1 10.2 1.8 3.24
122 72.72
c. The MSE (3-month MA forecast) is: MSE=122/9=13.5556
d. The MSE (5month MA) is: MSE=72.72/7=10.3886
Questions 1
The given dataset represents sales at a local supermarket recorded over the past 12 months.
Period Sales
January 11
February 13
March 9
April 8
May 16
June 15
July 8
August 10
September 15
October 8
November 10
December 12
a. Do a time series plot to determine the pattern of the data
18
16
14
12
10
8
6
4
2
0
b. Complete the table below:
Period sales 3-month Forecast 𝑺𝑺𝑺𝑺𝑺𝑺 5-month Forecast 𝑺𝑺𝑺𝑺𝑺𝑺
MA Error MA Error
forecast forecast
January 11
February 13
March 9
April 8 11 -3 9
May 16 10 6 36
June 15 11 4 16 11.4 3.6 12.96
July 8 13 -5 25 12.2 -4.2 17.64
August 10 13 -3 9 11.2 -1.2 1.44
September 15 11 4 16 11.4 3.6 12.96
October 8 11 -3 9 12.8 -4.8 23.04
November 10 11 -1 1 11.2 -1.2 1.44
December 12 11 1 1 10.2 1.8 3.24
122 72.72
c. The MSE (3-month MA forecast) is: MSE=122/9=13.5556
d. The MSE (5month MA) is: MSE=72.72/7=10.3886