praxis 5003 math practice test Questions With
Complete Solutions
Which of the following expresses 3/16 as a percent?
A. 0.1875%
B. 1.875%
C. 5.33%
D. 18.75%
Option (D) is correct. The question requires an understanding of percent and
percentages. To convert a fraction to a percent, it is necessary to multiply the fraction by
100 and add a percent symbol. Since 316×100=18.75316×100=18.75, 316316 is
equivalent to 18.75%.
(3/16x100=18.75)
Which of the following is equal to 4(5−2)2−234(5−2)2−23 ?
A. 16
B. 28
C. 76
D.136
B
(pemdas)
A two-dimensional net of a certain three-dimensional figure includes five faces,
nine edges, and six vertices. Which of the following three-dimensional figures is
represented by the net?
A. Triangular pyramid
B. Triangular prism
C. Rectangular pyramid
D. Rectangular prism
Option (B) is correct. The question requires an understanding of three-dimensional
geometry. Triangular pyramids and rectangular prisms have four and six faces,
,respectively. Triangular prisms have five faces: two are triangles, and three are
quadrilaterals. Rectangular pyramids also have five faces: one is a rectangle, and four
are triangles. Triangular prisms have nine edges, while rectangular pyramids only have
eight edges.
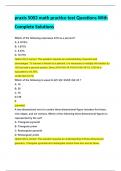
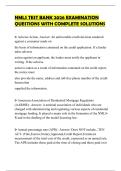
Which of the following is demonstrated by the figure shown?
1/1 1/2 1/3 1/4
A.When the numerator stays the same and the denominator increases, the
fraction increases.
B.When the numerator stays the same and the denominator increases, the
fraction decreases.
C.When the denominator stays the same and the numerator increases, the
fraction increases.
D.When the denominator stays the same and the numerator increases, the
fraction decreases.
Option (B) is correct.The question requires an understanding of fractions and how to
use geometrical representations to compare fractions. All of the fractions shown are unit
fractions; that is, fractions in which the numerator is 1. The models accompanying each
of the four given fractions are called tape models. In a tape model, the length of the tape
represents one whole. This whole can then be divided into pieces of equal lengths, and
the length of each piece represents a unit fraction. The way in which the models are
organized and displayed shows that the length that represents the fractional part of the
whole becomes shorter as the whole is subdivided into more parts of equal length. This
is a pictorial representation that demonstrates that if the numerator of a set of fractions
is fixed and does not change, the size of the number represented by the fractions will
decrease as the denominators are increased.
1 52
2 79
3 44
4 110
5 90
6 68
, 7 125
8 96
9 88
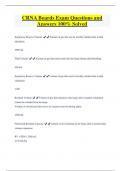
Bobby runs a small store. The total number of customers who shopped at the
store during each of nine consecutive weeks is recorded in the chart shown. If
the number of customers who shopped at the store during the tenth week were
included in the data, the mean and median of the data would change but the
range would not change. Which of the following could be the number of
customers who shopped at the store during the tenth week?
A. 39
B. 41
C. 73
D.132
Option (C) is correct. The question requires an understanding of basic statistical
concepts. The range is obtained by subtracting the smallest value, 44, from the largest
value, 125. In order to modify the mean and median but not the range, the number of
customers that shopped at the store during the tenth week must be greater or equal to
44 and less than or equal to 125.
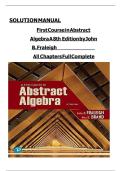
chicken chicken spaghetti chicken pizza pizza tacos chicken pizza pizza pizza
tacos spaghetti tacos spaghetti tacos tacos spaghetti tacos tacos
A teacher asked 20 students to name their favorite school lunch. The students'
responses are shown in the table.
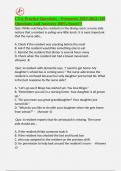
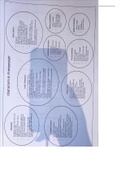
The teacher then asked the students to organize and display the data in a bar
graph. Which bar graph correctly displays the data?
A.
B.
C.
D.
c
Complete Solutions
Which of the following expresses 3/16 as a percent?
A. 0.1875%
B. 1.875%
C. 5.33%
D. 18.75%
Option (D) is correct. The question requires an understanding of percent and
percentages. To convert a fraction to a percent, it is necessary to multiply the fraction by
100 and add a percent symbol. Since 316×100=18.75316×100=18.75, 316316 is
equivalent to 18.75%.
(3/16x100=18.75)
Which of the following is equal to 4(5−2)2−234(5−2)2−23 ?
A. 16
B. 28
C. 76
D.136
B
(pemdas)
A two-dimensional net of a certain three-dimensional figure includes five faces,
nine edges, and six vertices. Which of the following three-dimensional figures is
represented by the net?
A. Triangular pyramid
B. Triangular prism
C. Rectangular pyramid
D. Rectangular prism
Option (B) is correct. The question requires an understanding of three-dimensional
geometry. Triangular pyramids and rectangular prisms have four and six faces,
,respectively. Triangular prisms have five faces: two are triangles, and three are
quadrilaterals. Rectangular pyramids also have five faces: one is a rectangle, and four
are triangles. Triangular prisms have nine edges, while rectangular pyramids only have
eight edges.
Which of the following is demonstrated by the figure shown?
1/1 1/2 1/3 1/4
A.When the numerator stays the same and the denominator increases, the
fraction increases.
B.When the numerator stays the same and the denominator increases, the
fraction decreases.
C.When the denominator stays the same and the numerator increases, the
fraction increases.
D.When the denominator stays the same and the numerator increases, the
fraction decreases.
Option (B) is correct.The question requires an understanding of fractions and how to
use geometrical representations to compare fractions. All of the fractions shown are unit
fractions; that is, fractions in which the numerator is 1. The models accompanying each
of the four given fractions are called tape models. In a tape model, the length of the tape
represents one whole. This whole can then be divided into pieces of equal lengths, and
the length of each piece represents a unit fraction. The way in which the models are
organized and displayed shows that the length that represents the fractional part of the
whole becomes shorter as the whole is subdivided into more parts of equal length. This
is a pictorial representation that demonstrates that if the numerator of a set of fractions
is fixed and does not change, the size of the number represented by the fractions will
decrease as the denominators are increased.
1 52
2 79
3 44
4 110
5 90
6 68
, 7 125
8 96
9 88
Bobby runs a small store. The total number of customers who shopped at the
store during each of nine consecutive weeks is recorded in the chart shown. If
the number of customers who shopped at the store during the tenth week were
included in the data, the mean and median of the data would change but the
range would not change. Which of the following could be the number of
customers who shopped at the store during the tenth week?
A. 39
B. 41
C. 73
D.132
Option (C) is correct. The question requires an understanding of basic statistical
concepts. The range is obtained by subtracting the smallest value, 44, from the largest
value, 125. In order to modify the mean and median but not the range, the number of
customers that shopped at the store during the tenth week must be greater or equal to
44 and less than or equal to 125.
chicken chicken spaghetti chicken pizza pizza tacos chicken pizza pizza pizza
tacos spaghetti tacos spaghetti tacos tacos spaghetti tacos tacos
A teacher asked 20 students to name their favorite school lunch. The students'
responses are shown in the table.
The teacher then asked the students to organize and display the data in a bar
graph. Which bar graph correctly displays the data?
A.
B.
C.
D.
c