Summary of Econometrics
CHAPTER 1 (Week 1)
An Overview of Regression Analysis
-Econometrics attempts to quantify economic reality and bridge the gap between the abstract
world of economic theory and the real world of human activity.
-nonexperimental quantitative research:
1. specifying the models or relationships to be studied
2. collecting the data needed to quantify the models
3. quantifying the models with the data
What Is Regression Analysis?
Dependent Variables, Independent Variables, and Causality
-Regression analysis is a statistical technique that attempts to “explain” movements in one
variable, the dependent variable, as a function of movements in a set of other variables, called
the independent (or explanatory) variables, through the quantification of one or more
equations.
Q is the dependent variable and P, PS, and Yd are the independent variables.
-If events A and B are related statistically, it may be that A causes B, that B causes A, that
some omitted factor causes both, or that a chance correlation exists between the two.
Single-Equation Linear Models
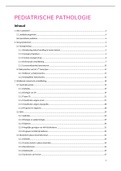
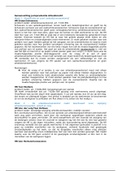
,-The Bs are the coefficients that determine the coordinates of the straight line at any point. B0
is the constant or intercept term; it indicates the value of Y when X equals zero. B1 is the
slope coefficient, and it indicates the amount that Y will change when X increases by one
unit.
-For linear (i.e., straight-line) regression models, the response in the predicted value of Y due
to a change in X is constant and equal to the slope coefficient B1:
The Stochastic Error Term
-variation probably comes from sources such as omitted influences, measurement error,
incorrect functional form, or purely random and totally unpredictable occurrences.
-A stochastic error term is a term that is added to a regression equation to introduce all of the
variation in Y that cannot be explained by the included Xs.
-B0 + B1X is called the deterministic component of the regression equation because it
indicates the value of Y that is determined by a given value of X, which is assumed to be
nonstochastic.
Extending the Notation
-A typical observation (or unit of analysis) is an individual person, year, or country.
-Example 1:
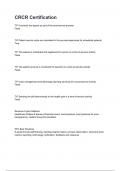
The theory behind this equation is that, other things being equal, the taller a person is the
more they tend to weigh. The dependent variable in such an equation would be the weight of
the person, while the independent variable would be that person’s height:
- Example 2:
we want to understand how wages are determined in a particular field, perhaps because we
think that there might be discrimination in that field. The wage of a worker would be the
dependent variable (WAGE). three of the most common are the work experience (EXP),
education (EDU), and gender (GEND) of the worker, so let’s use these.
,The last variable, GEND, is unusual in that it can take on only two values, 0 and 1; this kind
of variable is called a dummy variable, and it’s extremely useful when we want to quantify a
concept that is inherently qualitative
The correct answer is that B1 gives us the impact on wages of a one-year increase in
experience, holding constant education and gender. This is a significant difference, because it
allows researchers to control for specific complicating factors without running controlled
experiments.
The Estimated Regression Equation
Using Regression to Explain Housing Prices
- you decide to collect data on all local houses that were sold within the last few weeks and to
build a regression model of the sales prices of the houses as a function of their sizes. cross-
sectional because all of the observations are from the same point in time and represent
different individual economic entities (like countries or, in this case, houses) from that same
point in time.
- To measure the impact of size on price, you include the size of the house as an independent
variable in a regression equation that has the price of that house as the dependent variable
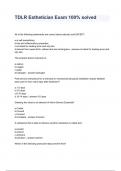
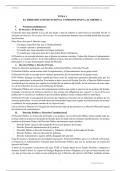
- The most important coefficient is B1 = 0.138, since the reason for the regression is to find
out the impact of size on price. This coefficient means that if size increases by 1 square foot,
price will increase by 0.138 thousand dollars ($138). B1 thus measures the change in PRICEi
associated with a one-unit increase in SIZEi. B0 is the estimate of the constant or intercept
term. In our equation, it means that price equals 40.0 when size equals zero.
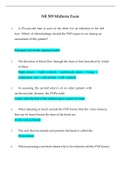
- If you calculate a Y (predicted price) for a house that is the same size (1,600 square feet) as
the one you’re thinking of buying, you can then compare this Y with the asking price of
$230,000. To do this, substitute 1600 for SIZEi
, The owner is asking “only” $230,000 for a house when the size implies a price of $260,800!
Perhaps your original feeling that the price was too high was a reaction to steep housing
prices in general and not a reflection of this specific price.
CHAPTER 2
Ordinary Least Squares
Estimating Single-Independent-Variable Models with OLS
- The purpose of regression analysis is to take a purely theoretical equation like:
and use a set of data to create an estimated equation like:
where each “hat” indicates a sample estimate of the true population value. (In the case of Y,
the “true population value” is The purpose of the estimation technique is to obtain
numerical values for the coefficients of an otherwise completely theoretical regression
equation. ordinary least squares
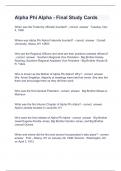
- Ordinary Least Squares (OLS) is a regression estimation technique that calculates the B so
as to minimize the sum of the squared residuals, thus:
is equivalent to saying that OLS
minimizes
Why Use Ordinary Least Squares?
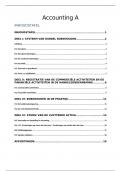
- OLS is that minimizing the summed, squared residuals is a reasonable goal for an estimation
technique. To see this, recall that the residual measures how close the estimated regression
equation comes to the actual observed data:
- The final reason for using OLS is that its estimates have at least two useful properties:
1. The sum of the residuals is exactly zero.
2. OLS can be shown to be the “best” estimator possible under a set of specific assumptions.
- An estimator is a mathematical technique that is applied to a sample of data to produce a
real-world numerical estimate of the true population regression coefficient (or other
parameters). Thus, OLS is an estimator, and a B produced by OLS is an estimate.
CHAPTER 1 (Week 1)
An Overview of Regression Analysis
-Econometrics attempts to quantify economic reality and bridge the gap between the abstract
world of economic theory and the real world of human activity.
-nonexperimental quantitative research:
1. specifying the models or relationships to be studied
2. collecting the data needed to quantify the models
3. quantifying the models with the data
What Is Regression Analysis?
Dependent Variables, Independent Variables, and Causality
-Regression analysis is a statistical technique that attempts to “explain” movements in one
variable, the dependent variable, as a function of movements in a set of other variables, called
the independent (or explanatory) variables, through the quantification of one or more
equations.
Q is the dependent variable and P, PS, and Yd are the independent variables.
-If events A and B are related statistically, it may be that A causes B, that B causes A, that
some omitted factor causes both, or that a chance correlation exists between the two.
Single-Equation Linear Models
,-The Bs are the coefficients that determine the coordinates of the straight line at any point. B0
is the constant or intercept term; it indicates the value of Y when X equals zero. B1 is the
slope coefficient, and it indicates the amount that Y will change when X increases by one
unit.
-For linear (i.e., straight-line) regression models, the response in the predicted value of Y due
to a change in X is constant and equal to the slope coefficient B1:
The Stochastic Error Term
-variation probably comes from sources such as omitted influences, measurement error,
incorrect functional form, or purely random and totally unpredictable occurrences.
-A stochastic error term is a term that is added to a regression equation to introduce all of the
variation in Y that cannot be explained by the included Xs.
-B0 + B1X is called the deterministic component of the regression equation because it
indicates the value of Y that is determined by a given value of X, which is assumed to be
nonstochastic.
Extending the Notation
-A typical observation (or unit of analysis) is an individual person, year, or country.
-Example 1:
The theory behind this equation is that, other things being equal, the taller a person is the
more they tend to weigh. The dependent variable in such an equation would be the weight of
the person, while the independent variable would be that person’s height:
- Example 2:
we want to understand how wages are determined in a particular field, perhaps because we
think that there might be discrimination in that field. The wage of a worker would be the
dependent variable (WAGE). three of the most common are the work experience (EXP),
education (EDU), and gender (GEND) of the worker, so let’s use these.
,The last variable, GEND, is unusual in that it can take on only two values, 0 and 1; this kind
of variable is called a dummy variable, and it’s extremely useful when we want to quantify a
concept that is inherently qualitative
The correct answer is that B1 gives us the impact on wages of a one-year increase in
experience, holding constant education and gender. This is a significant difference, because it
allows researchers to control for specific complicating factors without running controlled
experiments.
The Estimated Regression Equation
Using Regression to Explain Housing Prices
- you decide to collect data on all local houses that were sold within the last few weeks and to
build a regression model of the sales prices of the houses as a function of their sizes. cross-
sectional because all of the observations are from the same point in time and represent
different individual economic entities (like countries or, in this case, houses) from that same
point in time.
- To measure the impact of size on price, you include the size of the house as an independent
variable in a regression equation that has the price of that house as the dependent variable
- The most important coefficient is B1 = 0.138, since the reason for the regression is to find
out the impact of size on price. This coefficient means that if size increases by 1 square foot,
price will increase by 0.138 thousand dollars ($138). B1 thus measures the change in PRICEi
associated with a one-unit increase in SIZEi. B0 is the estimate of the constant or intercept
term. In our equation, it means that price equals 40.0 when size equals zero.
- If you calculate a Y (predicted price) for a house that is the same size (1,600 square feet) as
the one you’re thinking of buying, you can then compare this Y with the asking price of
$230,000. To do this, substitute 1600 for SIZEi
, The owner is asking “only” $230,000 for a house when the size implies a price of $260,800!
Perhaps your original feeling that the price was too high was a reaction to steep housing
prices in general and not a reflection of this specific price.
CHAPTER 2
Ordinary Least Squares
Estimating Single-Independent-Variable Models with OLS
- The purpose of regression analysis is to take a purely theoretical equation like:
and use a set of data to create an estimated equation like:
where each “hat” indicates a sample estimate of the true population value. (In the case of Y,
the “true population value” is The purpose of the estimation technique is to obtain
numerical values for the coefficients of an otherwise completely theoretical regression
equation. ordinary least squares
- Ordinary Least Squares (OLS) is a regression estimation technique that calculates the B so
as to minimize the sum of the squared residuals, thus:
is equivalent to saying that OLS
minimizes
Why Use Ordinary Least Squares?
- OLS is that minimizing the summed, squared residuals is a reasonable goal for an estimation
technique. To see this, recall that the residual measures how close the estimated regression
equation comes to the actual observed data:
- The final reason for using OLS is that its estimates have at least two useful properties:
1. The sum of the residuals is exactly zero.
2. OLS can be shown to be the “best” estimator possible under a set of specific assumptions.
- An estimator is a mathematical technique that is applied to a sample of data to produce a
real-world numerical estimate of the true population regression coefficient (or other
parameters). Thus, OLS is an estimator, and a B produced by OLS is an estimate.