AQA
GCSE
GEOGRAPHY
Paper 2 Challenges in the Human
Environment
June 2023
, 2
Do not write
outside the
box
For the multiple-choice questions, shade the circle next to the correct answer.
CORRECT METHOD WRONG METHODS
If you want to change your answer you must cross out your original answer as shown.
If you wish to return to an answer previously crossed out, ring the answer you now wish to
select as shown.
Section A Urban issues and challenges
Answer all questions in this section.
Question 1 Urban issues and challenges
0 1 . 1 Give one reason for the growth of megacities in LIC/NEEs.
[1 mark]
G/Jun23/8035/2
, 3
Do not write
outside the
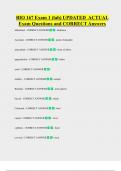
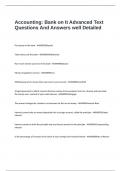
Study Figure 1, a table showing the projected population of the world’s ten largest box
cities in 2030.
Figure 1
Projected
City population in 2030
(millions)
Delhi, India 38.9
Tokyo, Japan 36.6
Shanghai, China 32.9
Dhaka, Bangladesh 28.0
Al-Qahirah (Cairo), Egypt 25.5
Mumbai (Bombay), India 24.6
Beijing, China 24.3
Mexico City, Mexico 24.1
Sao Paulo, Brazil 23.8
Kinshasa, Democratic Republic of the Congo 21.9
0 1 . 2 Calculate the mean size of the cities shown in Figure 1.
Answer to one decimal place.
[2 marks]
Show your working
Answer millions
Question 1 continues on the next page
Turn over ▶
G/Jun23/8035/2
, 4
Do not write
outside the
box
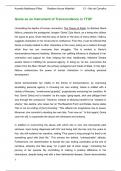
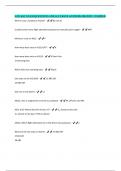
Study Figure 2, a graph showing selected crimes reported on Twitter in Mexico City,
a city in a NEE, September 2016 – April 2017.
Figure 2
Street
robbery
Theft of
motor vehicle
Type of Business
crime burglary
reported
Card
fraud
Domestic
burglary
0 100 200 300 400 500 600 700 800 900 1000
Number of reports
0 1 . 3 Complete Figure 2 using the following data.
[1 mark]
Number of reports
Crime
Sept 2016 – Apr 2017
Theft of motor vehicle 350
0 1 . 4 Approximately how much more frequent is street robbery than business burglary?
Shade one circle only.
[1 mark]
A 2 times
B 3 times
C 4 times
D 5 times
G/Jun23/8035/2
GCSE
GEOGRAPHY
Paper 2 Challenges in the Human
Environment
June 2023
, 2
Do not write
outside the
box
For the multiple-choice questions, shade the circle next to the correct answer.
CORRECT METHOD WRONG METHODS
If you want to change your answer you must cross out your original answer as shown.
If you wish to return to an answer previously crossed out, ring the answer you now wish to
select as shown.
Section A Urban issues and challenges
Answer all questions in this section.
Question 1 Urban issues and challenges
0 1 . 1 Give one reason for the growth of megacities in LIC/NEEs.
[1 mark]
G/Jun23/8035/2
, 3
Do not write
outside the
Study Figure 1, a table showing the projected population of the world’s ten largest box
cities in 2030.
Figure 1
Projected
City population in 2030
(millions)
Delhi, India 38.9
Tokyo, Japan 36.6
Shanghai, China 32.9
Dhaka, Bangladesh 28.0
Al-Qahirah (Cairo), Egypt 25.5
Mumbai (Bombay), India 24.6
Beijing, China 24.3
Mexico City, Mexico 24.1
Sao Paulo, Brazil 23.8
Kinshasa, Democratic Republic of the Congo 21.9
0 1 . 2 Calculate the mean size of the cities shown in Figure 1.
Answer to one decimal place.
[2 marks]
Show your working
Answer millions
Question 1 continues on the next page
Turn over ▶
G/Jun23/8035/2
, 4
Do not write
outside the
box
Study Figure 2, a graph showing selected crimes reported on Twitter in Mexico City,
a city in a NEE, September 2016 – April 2017.
Figure 2
Street
robbery
Theft of
motor vehicle
Type of Business
crime burglary
reported
Card
fraud
Domestic
burglary
0 100 200 300 400 500 600 700 800 900 1000
Number of reports
0 1 . 3 Complete Figure 2 using the following data.
[1 mark]
Number of reports
Crime
Sept 2016 – Apr 2017
Theft of motor vehicle 350
0 1 . 4 Approximately how much more frequent is street robbery than business burglary?
Shade one circle only.
[1 mark]
A 2 times
B 3 times
C 4 times
D 5 times
G/Jun23/8035/2