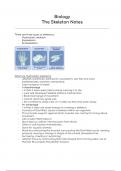
Biology
Practical Paper NB and things to Remember
Graphs:
1. Independent variable…
- X-Axis
- What changes?
- It is what you change.
- Cause.
- Eg) Age, time (days/weeks/months/years etc.), temperature and the amount of
water.
2. Dependent variable…
- Y-Axis (the result)
- What is being studied or measured.
- It is what changed because of that.
- Effect.
- Eg) Depends on independent variables. (Like it could be height) so like how tall
the subject grows.
, 3. Bar graph…
- When there is one set of values.
- One column (dependent variable is a value)
- Independent variable is the description. (like January, february etc)
- There are spaces between the bars.
4. Line graph…
- Both sets up data in the table are values.
- Will draw 2 lines on the same graph.
- Use keys AND it MUST be done in pencil.
= Circle for one thing
= Cross for one thing.
5. Histogram…
- Bar graph with no spaces.
6. Heading…
- Graph showing blabababa.
= Use the information provided.
7. Qualitative vs Quantitative…
- Quantitative data
= Is values.
= More objective. (can check the answer)
= How many …..
= How to do this is like time how long it took.
- Qualitative data
= Is a description.
= Its appearance.
= More subjective. (open to investigation)