Class Quantitative Methods
Date Monday 4 September 2023
Topic Introduction, Data collection, variable types and methods of analysis, OLS
Theme block 1: Intro, Variables and Techniques, OLS
Structure and organization
Recording will be available as soon as possible after the lecture. They will remain available for four
days after the lecture. After that, they will be taken offline. They will be online again two weeks
before the exam date.
Using SPSS:
Watch tutorials about SPSS on Brightspace;
You can buy SPSS on surfspot.nl.
Grading structure:
Portfolio of weekly assignments (eligibility);
Written exam (60% of the final grade);
Final integrative assignment (40% of the final grade).
General considerations of quantitative methods
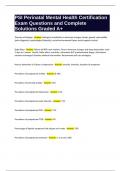
Deductive and inductive logic can be envisioned integral parts of an overall cycle of research as both
connect theory with empirical observations.
When researchers use deductive logic they first start with a broad theory and then articulate
specific hypotheses to test that theory and ten systematically collect data by which they can
test their hypotheses.
o Qualitative research.
When researchers use inductive logic they start with observations and from there start to see
patterns and from there start to develop theory.
o Quantitative research.
The unit of analysis is the level from which the data will be gathered, for example individual, family,
school, school district. The may be different units of analysis:
One for the dependent variable;
One for the independent variable.
A population is a group of individuals that have the same characteristic(s).
A sample is a subgroup of the target population that the researcher plans to study for the purpose of
making generalizations about the target population.
Samples are only estimates;
The difference between the sample estimate and the true population is the ‘’sampling error’’.
The sample is a part of the target population. For example all teachers in high schools in one city
could be the target population. And a sample of that could be all high school biology teachers.
Probability sampling is the selection of individuals from the population so that they are
representative of the population.
Nonprobability sampling is the selection of participants because they are available, convenient, or
represent some characteristic the investigator wants to study.
,Probability sampling:
Simple Random Sampling
- Selecting a sample form the population so all in the population have an equal chance of being
selected.
- Each *name* has an equal chance of being drawn.
Systematic Sampling
- Choosing every ‘’nth’’ individual or site in the population until the desired sample size is achieved.
- A alphabetic listing, choosing every 10th student.
Stratified Sampling
- Stratifying the population in a characteristic (e.g. gender) then sampling from each stratum.
- Divided the sample group, for example in man and women.
Multistage Cluster Sampling
- A sample chosen in one or two stages because the population is not easily identified or is large.
- First your cluster the samples, and that you set different stages.
Non-probability Sampling:
Convenience Sampling
- Participants are selected because they are willing and available to be studied.
- You choose a sample that is convience;
Snowball Sampling
- The researcher asks participants to identify other participants to become members of the sample.
- You use one student, and ask them to refer to another person.
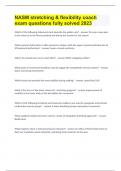
The population is 9000 students in a particular school. And there are 6000 boys and 3000 girls. You
want to get the proportional stratification sample from all the boys and girls.
Boys 200
N = 6000 0.66 of pop.
Girls 100
N = 3000 0.33 of pop.
N = 9000 Sample = 300
Linking Data Collection to Variables and Questions.
1. Identify the variable
2. Operationally define the variable
3. Locate data (measures, observations, documents with questions and scales)
4. Collect data on instruments yielding numeric scores.
e.g.:
1. Self-efficacy for learning form others
2. level of confidence that an individual can learn something by being taught by others
3. 13 items on a self-efficacy attitudinal scale grom Bergin (1989)
4. Scores of each item ranged from 0-10 with 10 begin ‘’completely confident.’’
An instrument is a tool for measuring, observing, or documenting quantitative data. Types of
instruments:
Performance measures (e.g., test performance)
Attitudinal measures (measures feelings toward educational topics)
Behavioral measures (observations of behavior)
Factual measures (documents, records)
,How do you locate or develop a instrument for data collection?
Look in published journal articles;
Run an ERIC search and a descriptor for the instrument you want in an online search to see if
there are articles that contain instruments;
Check Test in Print;
Check Mental Measurements Yearbook published by the Buros Center at the University of
Nebraska, Lincoln, NE (http:unl.edu/Buros)
Develop your own instrument.
Criteria for choosing a good instrument:
Actuality (Have authors developed the instrument recently?)
Cite (Is the instrument widely cited by other authors?)
Reviews (Are reviews available for the instrument?)
Match (Does the procedure for recording data fit the research questions/hypotheses in your
study?
Scales (Does the instrument contain accepted scales of measurements?)
Reliability/ Validity (Is there information about the reliability and validity of scores from past
uses of the instrument?
Reliability is the scores from measuring variables that are stable and consistent (e.g. bathroom scale).
Types of reliability:
Test-restest (scores are stable over time);
Alternate forms (equivalence of two instruments);
Alternate forms and test-retest;
Inter-rater reliability (similarity in observation of a behavior by two or more individuals);
Internal consistency (consistent scores across the instrument).
Validity is truth/ conclusions are accurate. Validity is the scores from measuring variables that are
meaningful. Types of validity:
Content (representative of all possible questions that could be asked);
Criterion-referenced (scores are a predictor of an outcome or criterion they are expected to
predict);
Construct (determination of the significance, meaning, purpose, and use the scores).
Reliability is necessary but not sufficient condition for validity.
Scales of Measurements:
Nominal (categorical) : categories that describe traits or characteristics participants can
check;
- You cannot calculate;
- Order doesn’t matter;
- E.g.: gender, age, color, etc.
Ordinal (categorical) : participants rank order a characteristic, trait, or attribute;
- Have a order;
- Can be given as frequencies;
- E.g.: Happy, happier, happiest.
Interval (continuous) : provides ‘’continuous’’ response possibilities to questions with
assumed equal distance. The interval scale has no zero point;
- Can be measured;
, - E.g.: temperature in Ceslius or Fahrenheit is at an interval scale because zero is not the lowest
possible temperature.
Ratio (continuous) : A scale with a true zero and equal distance among units.
- Can be measured;
- E.g.: distance, height
Procedures for administering the data collection:
Develop standard written procedures for administering an instrument;
Train researchers to collect observational data;
Obtain permission to collect and use public documents;
Respect individuals and sites during data gatherings (ethics).
Variable types and methods of analysis
There are different variable types:
1. Response variable (dependent variable) VS explanatory variable (independent variable)
- The dependent variable is a variable thought to be affected by changes in an independent variable.
You can think of this variable as an outcome. The dependent variable is the effect. Its value
depends on changes in the independent variable.
- The independent variable is a concept that you’re using to explain the concept. The independent
variable is the cause. Its value is independent of the other variables in your study, think of size,
age
2. Manifest variable VS latent variable
- Manifest variable is a concept that is measurable which is directly use in the analysis, think of age or
gender.
- Latent variable is a concept that is not directly observable like globalizing – international migration.
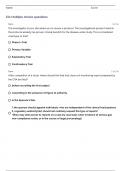
Dependent variable Method
Metric Linear regression (OLS) theme block 1
Ordinal Ordered logit regression
Nominal Multinomial logistic regression Theme block 2
Binary/binomial Logistic regression
Changes in time (metric) Time series analysis theme block 5
(duration/ survival analysis)
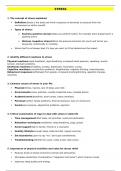
Linear regression: The model
Linear regression is a linear approach for modelling the relationship between a scalar response and
one or more explanatory variables (also known as dependent and independent).
The conditional expectation of a continuous variable Y is expressed as a linear function of the
explanatory variables X1, X2, Xm.
E (Yi|Xi) = ß0 + ß1Xi1 + ß2Xi2 + … + ßmXim
Where Xi stands for (Xi1,…,Xim).
Specific observations deviate randomly form the expected value, so we add a random error
term to the model:
Yi = E (Yi|Xi) + ϵi = ß0 + ß1Xi1 + ß2Xi2 + … + ßmXim + ϵi
E (ϵi) = 0
Date Monday 4 September 2023
Topic Introduction, Data collection, variable types and methods of analysis, OLS
Theme block 1: Intro, Variables and Techniques, OLS
Structure and organization
Recording will be available as soon as possible after the lecture. They will remain available for four
days after the lecture. After that, they will be taken offline. They will be online again two weeks
before the exam date.
Using SPSS:
Watch tutorials about SPSS on Brightspace;
You can buy SPSS on surfspot.nl.
Grading structure:
Portfolio of weekly assignments (eligibility);
Written exam (60% of the final grade);
Final integrative assignment (40% of the final grade).
General considerations of quantitative methods
Deductive and inductive logic can be envisioned integral parts of an overall cycle of research as both
connect theory with empirical observations.
When researchers use deductive logic they first start with a broad theory and then articulate
specific hypotheses to test that theory and ten systematically collect data by which they can
test their hypotheses.
o Qualitative research.
When researchers use inductive logic they start with observations and from there start to see
patterns and from there start to develop theory.
o Quantitative research.
The unit of analysis is the level from which the data will be gathered, for example individual, family,
school, school district. The may be different units of analysis:
One for the dependent variable;
One for the independent variable.
A population is a group of individuals that have the same characteristic(s).
A sample is a subgroup of the target population that the researcher plans to study for the purpose of
making generalizations about the target population.
Samples are only estimates;
The difference between the sample estimate and the true population is the ‘’sampling error’’.
The sample is a part of the target population. For example all teachers in high schools in one city
could be the target population. And a sample of that could be all high school biology teachers.
Probability sampling is the selection of individuals from the population so that they are
representative of the population.
Nonprobability sampling is the selection of participants because they are available, convenient, or
represent some characteristic the investigator wants to study.
,Probability sampling:
Simple Random Sampling
- Selecting a sample form the population so all in the population have an equal chance of being
selected.
- Each *name* has an equal chance of being drawn.
Systematic Sampling
- Choosing every ‘’nth’’ individual or site in the population until the desired sample size is achieved.
- A alphabetic listing, choosing every 10th student.
Stratified Sampling
- Stratifying the population in a characteristic (e.g. gender) then sampling from each stratum.
- Divided the sample group, for example in man and women.
Multistage Cluster Sampling
- A sample chosen in one or two stages because the population is not easily identified or is large.
- First your cluster the samples, and that you set different stages.
Non-probability Sampling:
Convenience Sampling
- Participants are selected because they are willing and available to be studied.
- You choose a sample that is convience;
Snowball Sampling
- The researcher asks participants to identify other participants to become members of the sample.
- You use one student, and ask them to refer to another person.
The population is 9000 students in a particular school. And there are 6000 boys and 3000 girls. You
want to get the proportional stratification sample from all the boys and girls.
Boys 200
N = 6000 0.66 of pop.
Girls 100
N = 3000 0.33 of pop.
N = 9000 Sample = 300
Linking Data Collection to Variables and Questions.
1. Identify the variable
2. Operationally define the variable
3. Locate data (measures, observations, documents with questions and scales)
4. Collect data on instruments yielding numeric scores.
e.g.:
1. Self-efficacy for learning form others
2. level of confidence that an individual can learn something by being taught by others
3. 13 items on a self-efficacy attitudinal scale grom Bergin (1989)
4. Scores of each item ranged from 0-10 with 10 begin ‘’completely confident.’’
An instrument is a tool for measuring, observing, or documenting quantitative data. Types of
instruments:
Performance measures (e.g., test performance)
Attitudinal measures (measures feelings toward educational topics)
Behavioral measures (observations of behavior)
Factual measures (documents, records)
,How do you locate or develop a instrument for data collection?
Look in published journal articles;
Run an ERIC search and a descriptor for the instrument you want in an online search to see if
there are articles that contain instruments;
Check Test in Print;
Check Mental Measurements Yearbook published by the Buros Center at the University of
Nebraska, Lincoln, NE (http:unl.edu/Buros)
Develop your own instrument.
Criteria for choosing a good instrument:
Actuality (Have authors developed the instrument recently?)
Cite (Is the instrument widely cited by other authors?)
Reviews (Are reviews available for the instrument?)
Match (Does the procedure for recording data fit the research questions/hypotheses in your
study?
Scales (Does the instrument contain accepted scales of measurements?)
Reliability/ Validity (Is there information about the reliability and validity of scores from past
uses of the instrument?
Reliability is the scores from measuring variables that are stable and consistent (e.g. bathroom scale).
Types of reliability:
Test-restest (scores are stable over time);
Alternate forms (equivalence of two instruments);
Alternate forms and test-retest;
Inter-rater reliability (similarity in observation of a behavior by two or more individuals);
Internal consistency (consistent scores across the instrument).
Validity is truth/ conclusions are accurate. Validity is the scores from measuring variables that are
meaningful. Types of validity:
Content (representative of all possible questions that could be asked);
Criterion-referenced (scores are a predictor of an outcome or criterion they are expected to
predict);
Construct (determination of the significance, meaning, purpose, and use the scores).
Reliability is necessary but not sufficient condition for validity.
Scales of Measurements:
Nominal (categorical) : categories that describe traits or characteristics participants can
check;
- You cannot calculate;
- Order doesn’t matter;
- E.g.: gender, age, color, etc.
Ordinal (categorical) : participants rank order a characteristic, trait, or attribute;
- Have a order;
- Can be given as frequencies;
- E.g.: Happy, happier, happiest.
Interval (continuous) : provides ‘’continuous’’ response possibilities to questions with
assumed equal distance. The interval scale has no zero point;
- Can be measured;
, - E.g.: temperature in Ceslius or Fahrenheit is at an interval scale because zero is not the lowest
possible temperature.
Ratio (continuous) : A scale with a true zero and equal distance among units.
- Can be measured;
- E.g.: distance, height
Procedures for administering the data collection:
Develop standard written procedures for administering an instrument;
Train researchers to collect observational data;
Obtain permission to collect and use public documents;
Respect individuals and sites during data gatherings (ethics).
Variable types and methods of analysis
There are different variable types:
1. Response variable (dependent variable) VS explanatory variable (independent variable)
- The dependent variable is a variable thought to be affected by changes in an independent variable.
You can think of this variable as an outcome. The dependent variable is the effect. Its value
depends on changes in the independent variable.
- The independent variable is a concept that you’re using to explain the concept. The independent
variable is the cause. Its value is independent of the other variables in your study, think of size,
age
2. Manifest variable VS latent variable
- Manifest variable is a concept that is measurable which is directly use in the analysis, think of age or
gender.
- Latent variable is a concept that is not directly observable like globalizing – international migration.
Dependent variable Method
Metric Linear regression (OLS) theme block 1
Ordinal Ordered logit regression
Nominal Multinomial logistic regression Theme block 2
Binary/binomial Logistic regression
Changes in time (metric) Time series analysis theme block 5
(duration/ survival analysis)
Linear regression: The model
Linear regression is a linear approach for modelling the relationship between a scalar response and
one or more explanatory variables (also known as dependent and independent).
The conditional expectation of a continuous variable Y is expressed as a linear function of the
explanatory variables X1, X2, Xm.
E (Yi|Xi) = ß0 + ß1Xi1 + ß2Xi2 + … + ßmXim
Where Xi stands for (Xi1,…,Xim).
Specific observations deviate randomly form the expected value, so we add a random error
term to the model:
Yi = E (Yi|Xi) + ϵi = ß0 + ß1Xi1 + ß2Xi2 + … + ßmXim + ϵi
E (ϵi) = 0