MAC 3702 EXAMS
SEMESTER2 2023
24 OCTOBER 2023
DISTINCTION GUARANTEED
OPENED: 24 OCT 2023
CLOSE BY: 24 OCT 2023
, Question 1
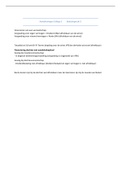
Ratio Calculation 2021 2022 Comment
The gross profit margin measures the
company's profitability. A higher
margin is desirable. A significant decline
GP%=Gross profit/Sales
from 2021 to 2022 (10.42% to 5.43%)
i. Gross Profit Margin 2021= 466/4475*100 10.42% 5.43%
indicates a substantial reduction in
2022= 327/6010*100
profitability, possibly due to increased
costs or decreased revenue. This is a
concerning trend.
The EBITDA to revenue ratio indicates
operating performance. A positive value
indicates profit, while a negative value
2022= (-166+19)/6010 suggests a loss. The drop from 5.01% in
ii. EBITDA to Revenue 5.01% -2.45%
2021 = (199+25)/4475 2021 to -2.45% in 2022 signifies a
substantial decline in operating
performance, turning into a loss. This is
a significant concern for the company.
The current ratio measures short-term
liquidity. A ratio above 1 indicates the
2022 company's ability to meet short-term
Current Ratio = 1,453 / obligations. Both 2021 and 2022
947 = 1.53 current ratios are above 1, indicating
iii. Current Ratio 1.50 1.53
2021 good short-term liquidity. There is a
Current Ratio = 1,624 / slight improvement from 2021 to 2022,
1,082 = 1.50 suggesting that the company's short-
term liquidity position has
strengthened slightly.
Use below formulars to
iv. Cash Conversion Cycle
calculate
Cash conversions cycle = inventory days + debtors’ days – creditors days
Creditors days 15 days in 2022 and 90 days in 2021
Inventory days = Inventory/cost of sales *365
Debtors days = debtors/ Revenue * 365
SEMESTER2 2023
24 OCTOBER 2023
DISTINCTION GUARANTEED
OPENED: 24 OCT 2023
CLOSE BY: 24 OCT 2023
, Question 1
Ratio Calculation 2021 2022 Comment
The gross profit margin measures the
company's profitability. A higher
margin is desirable. A significant decline
GP%=Gross profit/Sales
from 2021 to 2022 (10.42% to 5.43%)
i. Gross Profit Margin 2021= 466/4475*100 10.42% 5.43%
indicates a substantial reduction in
2022= 327/6010*100
profitability, possibly due to increased
costs or decreased revenue. This is a
concerning trend.
The EBITDA to revenue ratio indicates
operating performance. A positive value
indicates profit, while a negative value
2022= (-166+19)/6010 suggests a loss. The drop from 5.01% in
ii. EBITDA to Revenue 5.01% -2.45%
2021 = (199+25)/4475 2021 to -2.45% in 2022 signifies a
substantial decline in operating
performance, turning into a loss. This is
a significant concern for the company.
The current ratio measures short-term
liquidity. A ratio above 1 indicates the
2022 company's ability to meet short-term
Current Ratio = 1,453 / obligations. Both 2021 and 2022
947 = 1.53 current ratios are above 1, indicating
iii. Current Ratio 1.50 1.53
2021 good short-term liquidity. There is a
Current Ratio = 1,624 / slight improvement from 2021 to 2022,
1,082 = 1.50 suggesting that the company's short-
term liquidity position has
strengthened slightly.
Use below formulars to
iv. Cash Conversion Cycle
calculate
Cash conversions cycle = inventory days + debtors’ days – creditors days
Creditors days 15 days in 2022 and 90 days in 2021
Inventory days = Inventory/cost of sales *365
Debtors days = debtors/ Revenue * 365