Samenvatting Moore, McCabe & Craig: Introduction to the practice of statistics
Hoofdstuk 1
Cases are subjects in a study, units in a experiment etc.
Individuals are objects described in a set of data.
Variables describe characteristics of a case, they can have different values. A label is a variable used
to identify cases. Some variables are categorical/qualitative and others are quantitative.
The key characteristics of a data set answer the questions Who?, What? and Why?
Exploratory data analysis uses graphs and numerical summaries to describe the variables in a data
set and the relations among them. The distribution of a variable tells us what values is takes and how
often it takes these values.
Bar graphs and pie charts display the distributions of categorical variables. These graphs use the
counts or percents of the categories. Stemplots (for small data sets) and histograms (frequency table)
display the distributions of quantitative variables. Stempots seperate each observation into a stem
and a one-digit leaf. Histograms plot the frequencies (counts) of the percents of equal-width classes
of values.
When examining a distribution, look for shape, center (mean, median) and spread (sd, five number
summary) and for clear deviations from the overall shape. Some distributions have simple shapes,
such as symmetric or skewed. The number of modes (major peaks) is another aspect of overall
shape. Unimodal = a distribution with a major peak.
Outliers are observations that lie outside the overall pattern of a distribution.
When observations on a variable are taken over time, make a time plot that graphs time horizontally
and the values of the variable vertically. A time plot can reveal changes over time.
Categorical: bar graph, pie chart
Quantitative: stemplot and histogram
A numerical summary of a distribution should report its center and its spread or variability. The
mean x-bar and the median M describe the center of a distribution in different ways. The mean is the
arithmetic average of the observations, and the median is their midpoint. Find mean: (n+1)/2. When
you use the median to describe the center of a distribution, describe it’s spead by giving the
,Samenvatting Moore, McCabe & Craig: Introduction to the practice of statistics
quartiles. The first quartile Q1 has one-fourth of the observations below it, and the third quartile Q3
has three-fourths of the observations below it.
The interquartile range (Q3-Q1) is the difference between the quartiles. It’s the spread of the center
half of the data. The 1.5 x IQR rule flags observations more than 1.5 x IQR beyond the quartiles as
possible outliers.
The five-number summary consisting of the median, the quartiles and the smallest and largest
individual observations provides a quick overall description of a distribution. The median describes
the center, and the quartiles and extremes show the spread.
Boxplots based on the five number summary are useful for comparing several distributions. In a
modified boxplot, outliers are plotted individually. Side-by-side boxplots can be used to display
boxplots for more than group on the same graph.
The variance s2 and especially its square root, the standard Numerical measures of particular aspects of
deviation s, are common measures of spread about the mean as a distribution, such as center and spread, do
not report the entire shape of most
center. The standard deviation is zero when there is no spread. distributions. In some cases, particularly
Degrees of freedom of the variance or standard deviation = n-1. distributions with multiple peaks and gaps,
A resistant measure of any aspect of a distribution relatively these measures may not be very
unaffected by changes in the numerical value. The median and the informative
quartiles are resistant. The mean and standard deviation are not
resistant and are most useful for Normal distributions. The five-
number summary is a better description for skewed distributions.
Linear transformations have the form xnew = a + bx. A linear transformation changes the origin if a ≠
0 and changes the size of the unit of measurement is b > 0. Linear transformations do not change the
overall shape of a distribution. A linear transformation multiplies a measure of spread by b and
changes a percentile or measure of center m into a+bm.
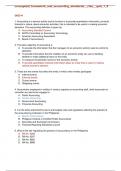
Five number summary boxplot Modified boxplot
Side by side boxplot
, Samenvatting Moore, McCabe & Craig: Introduction to the practice of statistics
The overall pattern of a distribution can often be described by a density curve (idealized overall
pattern) A density curve has a total area 1 underneath it. Areas under a density curve give
proportions of observations for the distribution. The mean mu (balance point), the median (equal
areas point) and the quartiles can be approximately located by eye on a density curve. The standard
deviation sigma cannot be located by eye on the most density curves. The mean and median are
equal for symmetric density curves, but the mean of a skewed curve is located farther toward the
long tail than is the median.
The Normal distributions are described by bell-shaped, symmetric, unimodal density curves. The
mean mu and the standard deviation sigma completely specify the Normal distribution N(mu, sigma).
All Normal distributions satisfy the 68-95-99.7 rule.
To standardize any observation x, subtract the mean of the distribution and then divide by the
standard deviation. The resulting z-score (z= (x-mu)/sigma) says how many standard deviations x lies
from the distribution mean.
If X has the N(mu, sigma) distribution, then the standardized variable Z=(X-mu)/sigma has the
standard Normal distribution N(0,1). The standard Normal table gives cumulative proportions of Z <
z for many values of z.
The adequacy of a Normal model for describing a distribution of data is best assessed by a Normal
quantile plot. A pattern on such a plot that deviates substantially from a straight line indicates that
the data are not Normal.
Symbolen
Hoofletters verwijzen naar een variabele, distributie of event
(Z, X)
Kleine letters verwijzen naar een waarde van een variabele,
distributie of event (z, x), dus vaak in een sample
Mu en x-bar verwijzen allebei naar de mean, maar mu is de
mean van een populatie (parameter) en x-bar is de mean
van een sample.
Sigma verwijst naar een parameter en sd (of s) verwijst naar
een standaarddeviatie in een steekproef.
Z-score en proporties er is geen verschil tussen kleiner dan (groter
dan) of gelijk / gelijk.
Hoofdstuk 1
Cases are subjects in a study, units in a experiment etc.
Individuals are objects described in a set of data.
Variables describe characteristics of a case, they can have different values. A label is a variable used
to identify cases. Some variables are categorical/qualitative and others are quantitative.
The key characteristics of a data set answer the questions Who?, What? and Why?
Exploratory data analysis uses graphs and numerical summaries to describe the variables in a data
set and the relations among them. The distribution of a variable tells us what values is takes and how
often it takes these values.
Bar graphs and pie charts display the distributions of categorical variables. These graphs use the
counts or percents of the categories. Stemplots (for small data sets) and histograms (frequency table)
display the distributions of quantitative variables. Stempots seperate each observation into a stem
and a one-digit leaf. Histograms plot the frequencies (counts) of the percents of equal-width classes
of values.
When examining a distribution, look for shape, center (mean, median) and spread (sd, five number
summary) and for clear deviations from the overall shape. Some distributions have simple shapes,
such as symmetric or skewed. The number of modes (major peaks) is another aspect of overall
shape. Unimodal = a distribution with a major peak.
Outliers are observations that lie outside the overall pattern of a distribution.
When observations on a variable are taken over time, make a time plot that graphs time horizontally
and the values of the variable vertically. A time plot can reveal changes over time.
Categorical: bar graph, pie chart
Quantitative: stemplot and histogram
A numerical summary of a distribution should report its center and its spread or variability. The
mean x-bar and the median M describe the center of a distribution in different ways. The mean is the
arithmetic average of the observations, and the median is their midpoint. Find mean: (n+1)/2. When
you use the median to describe the center of a distribution, describe it’s spead by giving the
,Samenvatting Moore, McCabe & Craig: Introduction to the practice of statistics
quartiles. The first quartile Q1 has one-fourth of the observations below it, and the third quartile Q3
has three-fourths of the observations below it.
The interquartile range (Q3-Q1) is the difference between the quartiles. It’s the spread of the center
half of the data. The 1.5 x IQR rule flags observations more than 1.5 x IQR beyond the quartiles as
possible outliers.
The five-number summary consisting of the median, the quartiles and the smallest and largest
individual observations provides a quick overall description of a distribution. The median describes
the center, and the quartiles and extremes show the spread.
Boxplots based on the five number summary are useful for comparing several distributions. In a
modified boxplot, outliers are plotted individually. Side-by-side boxplots can be used to display
boxplots for more than group on the same graph.
The variance s2 and especially its square root, the standard Numerical measures of particular aspects of
deviation s, are common measures of spread about the mean as a distribution, such as center and spread, do
not report the entire shape of most
center. The standard deviation is zero when there is no spread. distributions. In some cases, particularly
Degrees of freedom of the variance or standard deviation = n-1. distributions with multiple peaks and gaps,
A resistant measure of any aspect of a distribution relatively these measures may not be very
unaffected by changes in the numerical value. The median and the informative
quartiles are resistant. The mean and standard deviation are not
resistant and are most useful for Normal distributions. The five-
number summary is a better description for skewed distributions.
Linear transformations have the form xnew = a + bx. A linear transformation changes the origin if a ≠
0 and changes the size of the unit of measurement is b > 0. Linear transformations do not change the
overall shape of a distribution. A linear transformation multiplies a measure of spread by b and
changes a percentile or measure of center m into a+bm.
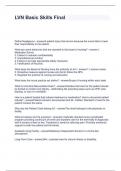
Five number summary boxplot Modified boxplot
Side by side boxplot
, Samenvatting Moore, McCabe & Craig: Introduction to the practice of statistics
The overall pattern of a distribution can often be described by a density curve (idealized overall
pattern) A density curve has a total area 1 underneath it. Areas under a density curve give
proportions of observations for the distribution. The mean mu (balance point), the median (equal
areas point) and the quartiles can be approximately located by eye on a density curve. The standard
deviation sigma cannot be located by eye on the most density curves. The mean and median are
equal for symmetric density curves, but the mean of a skewed curve is located farther toward the
long tail than is the median.
The Normal distributions are described by bell-shaped, symmetric, unimodal density curves. The
mean mu and the standard deviation sigma completely specify the Normal distribution N(mu, sigma).
All Normal distributions satisfy the 68-95-99.7 rule.
To standardize any observation x, subtract the mean of the distribution and then divide by the
standard deviation. The resulting z-score (z= (x-mu)/sigma) says how many standard deviations x lies
from the distribution mean.
If X has the N(mu, sigma) distribution, then the standardized variable Z=(X-mu)/sigma has the
standard Normal distribution N(0,1). The standard Normal table gives cumulative proportions of Z <
z for many values of z.
The adequacy of a Normal model for describing a distribution of data is best assessed by a Normal
quantile plot. A pattern on such a plot that deviates substantially from a straight line indicates that
the data are not Normal.
Symbolen
Hoofletters verwijzen naar een variabele, distributie of event
(Z, X)
Kleine letters verwijzen naar een waarde van een variabele,
distributie of event (z, x), dus vaak in een sample
Mu en x-bar verwijzen allebei naar de mean, maar mu is de
mean van een populatie (parameter) en x-bar is de mean
van een sample.
Sigma verwijst naar een parameter en sd (of s) verwijst naar
een standaarddeviatie in een steekproef.
Z-score en proporties er is geen verschil tussen kleiner dan (groter
dan) of gelijk / gelijk.