The Cartesian plane
Activity 1
your teachers help,label:
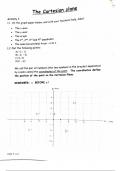
1.1 On the graph paper below, and with
The x-axis
The y-axis
The origin
The 1st, 2nd 3rd and 4th quadrants
The axes (accurately)from -4 to 4.
1.2 Plot the following points:
A(-2; 1)
B(-3; -2)
C(3; 3)
D(2; -2)
in the bracket separated
We call the pair of numbers (the two numbers
The coordinates define
by a semi-colon)the coordinates of the point.
the position of the point on the Cartesian Plane.
REMEMBER: x BEFORE y!
133 | P age
,Activity 2
Write down the coordinates of the points from A to L in the drawina below
10+ A(4; -)
B(-2, -2)
E"
El4,5;7)
"K D
c(6,4)
H(2,2)
4
3
3 (S,7)
2
K(2;s)
10 11
-2+
B
-3
4
Activity 3 following points. Label and number the
the graph paper below to plot the and see what picture is
Use in alphabetical order
axes first. Join the points
revealed.
A(-6; -3)
B(-3; -1)
C(2; 1)
D(5; -1)
E(5; -4)
F(6; 0)
G(3; 3)
H(4; 4)
I(5; 4)
J(3; 5)
K(2; 4)
L(0; 6)
M(-5; 5)
N(-1;5)
O(0; 3)
P(-3; 0)
Q(-7; -1)
R(-4; -1)
A(-6; -3)
134 | P age
, Functions
Afunction is a
relationship variables; x (the input value)and y (the
ouTpuT Value) where for egchbetween
two
innut value there is only one oupa
Consider the function: y= 2x+1
We can represent this as the flow diagram seen below:
INPUT VALUE (x) x 2 +1 OUTPUT VALUE (y)
We can also represent the function in a table format:
-3 -2 -1 1 2 3
-5 -3 -1 1 3 5 7
These values can also be representedas a araph if we plot the x and y
coordinate pairs.
Why is y = 2x + 1 an example of afunction?
hat core pords with
Why do you think the graph ends and starts with two arrows?
ynput cune culput vulues
What kind of function does the graph
represent?
Activity 1
your teachers help,label:
1.1 On the graph paper below, and with
The x-axis
The y-axis
The origin
The 1st, 2nd 3rd and 4th quadrants
The axes (accurately)from -4 to 4.
1.2 Plot the following points:
A(-2; 1)
B(-3; -2)
C(3; 3)
D(2; -2)
in the bracket separated
We call the pair of numbers (the two numbers
The coordinates define
by a semi-colon)the coordinates of the point.
the position of the point on the Cartesian Plane.
REMEMBER: x BEFORE y!
133 | P age
,Activity 2
Write down the coordinates of the points from A to L in the drawina below
10+ A(4; -)
B(-2, -2)
E"
El4,5;7)
"K D
c(6,4)
H(2,2)
4
3
3 (S,7)
2
K(2;s)
10 11
-2+
B
-3
4
Activity 3 following points. Label and number the
the graph paper below to plot the and see what picture is
Use in alphabetical order
axes first. Join the points
revealed.
A(-6; -3)
B(-3; -1)
C(2; 1)
D(5; -1)
E(5; -4)
F(6; 0)
G(3; 3)
H(4; 4)
I(5; 4)
J(3; 5)
K(2; 4)
L(0; 6)
M(-5; 5)
N(-1;5)
O(0; 3)
P(-3; 0)
Q(-7; -1)
R(-4; -1)
A(-6; -3)
134 | P age
, Functions
Afunction is a
relationship variables; x (the input value)and y (the
ouTpuT Value) where for egchbetween
two
innut value there is only one oupa
Consider the function: y= 2x+1
We can represent this as the flow diagram seen below:
INPUT VALUE (x) x 2 +1 OUTPUT VALUE (y)
We can also represent the function in a table format:
-3 -2 -1 1 2 3
-5 -3 -1 1 3 5 7
These values can also be representedas a araph if we plot the x and y
coordinate pairs.
Why is y = 2x + 1 an example of afunction?
hat core pords with
Why do you think the graph ends and starts with two arrows?
ynput cune culput vulues
What kind of function does the graph
represent?