PMCC Hypothesis Testing - Revision
Dependant and independent variables
Independent variables:
The number of goals scored by a premier league football team in a season
The amount of rain falling on a field
The number of people visiting a bar
Dependent variables:
The number of points a team has in the league table
The weight of a crop yielded while the crop is growing
The volume of beer sold in an evening
Controlled Variables
Sometimes, one or both of the variables are controlled, so that the variable only
assumes a set of predetermined values; for example, the times at which
temperature measurements are taken at a meteorological station. Controlled
variables are non-random. Situations in which the independent variable is
controlled and the dependent variable is random form the basis of regression
analysis.
Mean formula
Product moment correlation
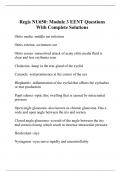
, Where there is a positive correlation most or all of the data points will fall in
Regions 1 and 3 and so you would expect the sum of these products to be positive
and large.
Where there is a negative correlation as in the case shown in the text book (page
81), most or all of the points will be in Regions 2 and 4 an d so you would expect
the sum of these products to be negative and large.
Where there is little or no correlation, the points will be scattered around all four
regions. Those in Regions 1 and 3 will result in positive values or (x, - x)(y, - y) but
when you add these to the negative values from the points in Regions 2 and 4 you
would expect most of them to cancel each other out. Consequently, the total value
of all the terms should be small.
The sum of terms is denoted by:
By itself this does not tell you very much because:
No allowance has been made for the number of items of data
No allowance has been made for the spread within the data
No allowance has been made for the units of x and y
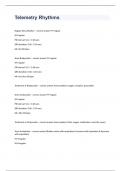
Pearson's Product Moment Correlation Coefficient
To allow for both the number of items and the spread within the data, together
with the units of x and y, the value of Sxy is divided by the square root of the
product of Sxx and Syy.
Dependant and independent variables
Independent variables:
The number of goals scored by a premier league football team in a season
The amount of rain falling on a field
The number of people visiting a bar
Dependent variables:
The number of points a team has in the league table
The weight of a crop yielded while the crop is growing
The volume of beer sold in an evening
Controlled Variables
Sometimes, one or both of the variables are controlled, so that the variable only
assumes a set of predetermined values; for example, the times at which
temperature measurements are taken at a meteorological station. Controlled
variables are non-random. Situations in which the independent variable is
controlled and the dependent variable is random form the basis of regression
analysis.
Mean formula
Product moment correlation
, Where there is a positive correlation most or all of the data points will fall in
Regions 1 and 3 and so you would expect the sum of these products to be positive
and large.
Where there is a negative correlation as in the case shown in the text book (page
81), most or all of the points will be in Regions 2 and 4 an d so you would expect
the sum of these products to be negative and large.
Where there is little or no correlation, the points will be scattered around all four
regions. Those in Regions 1 and 3 will result in positive values or (x, - x)(y, - y) but
when you add these to the negative values from the points in Regions 2 and 4 you
would expect most of them to cancel each other out. Consequently, the total value
of all the terms should be small.
The sum of terms is denoted by:
By itself this does not tell you very much because:
No allowance has been made for the number of items of data
No allowance has been made for the spread within the data
No allowance has been made for the units of x and y
Pearson's Product Moment Correlation Coefficient
To allow for both the number of items and the spread within the data, together
with the units of x and y, the value of Sxy is divided by the square root of the
product of Sxx and Syy.