PSYC1010: Units 4 & 5
Normal Distribution and Confidence Intervals
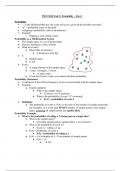
Probability
“...is the likelihood that any one event will occur, given all the possible outcomes”
“p” = probability (ratio or decimal)
Ex. 1: flipping a coin
o 1 head, 1 tail
p = 0.50
o Both outcomes are equally likely to occur
Ex. 2: rolling 1 dice
o 6 faces
o Probability of rolling a 2 is …
o P = 1/6 or 0.167
Distribution of Scores
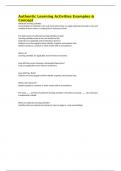
Height of Adults
Mean = 69 inches (original units) = 0 (z-score units OR standard deviation units)
Standard deviation = + 3 inches
3 standard deviations from mean
o 0.13% of the pop.
Probability
Proportion of the total area under the curve for particular scores equals the probability of
those scores
1.96
Sampling Error
Sampling Distribution of Means
o Measure many samples with 100 male University students in each sample
Assumption
o Samples are randomly selected and valid representations of the population
Sampling Error = x̄ - µ
o The larger the error, the less accurate the sample represents the pop.
The sample must be “different”
As n increases, variability (σX̅) from mean is reduced
n = sample size
σX̅ = σ / √n
o Standard error of the mean
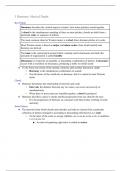
Birth Weights
o Lots of samples (thousands), with 10 babies in each sample
n = 10
o s X̅ = s / √n
o s X̅ = 30 / √10
o s X̅ = 9.5lbs
, 1. More samples had a sample mean = to pop. mean
2. More samples have means that are closer to the pop. mean
Central Limit Theorem
o Sampling distributions of means always:
1. Forms an approximately normal distribution
2. Has a sample mean equal to the population mean (μ) from which it was
created
3. Has a standard deviation that is mathematically related to the standard
deviation of the raw score pop.
o Standard error of the mean (X̅) is a function of standard deviation & sample size
X̅ = / √n
Confidence Intervals
Range of sample data to determine a range of population means that are NOT
significantly different from the sample mean
Point Estimate
o A single value obtained directly from sample data (mean)
Interval Estimate
o Range of sample data that we suspect (with a degree of confidence) within which
the population mean resides
Confidence Intervals (CI)
o Range of scores with specific boundaries (confidence limits), that should contain
the population mean
o Not a single value!
o CI = x̄ (z) sX̅
x̄ = sample mean
z = z-score (need %)
sX̅ = standard error of the mean
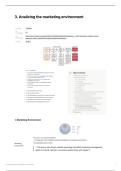
Confidence Intervals
Developing a confidence interval
Standard levels of confidence: 95% OR 99% (not both)
Example: Use 95% confidence level
o Capture 95% of area under the “normal” distribution
o This occurs at a standard deviation (z) of 1.96
o Find: sample mean, and standard error of the mean
o 5% chance that the pop. mean is not in the interval
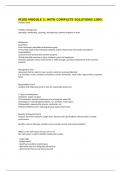
What if the sample size is “small”?
o Usually performed with samples smaller than 30
o Use the t-distribution, not z-distribution
Why
Variability decreases with larger sample sizes
T-distribution curves more platykurtic
T-distribution depends on sample size
Normal Distribution and Confidence Intervals
Probability
“...is the likelihood that any one event will occur, given all the possible outcomes”
“p” = probability (ratio or decimal)
Ex. 1: flipping a coin
o 1 head, 1 tail
p = 0.50
o Both outcomes are equally likely to occur
Ex. 2: rolling 1 dice
o 6 faces
o Probability of rolling a 2 is …
o P = 1/6 or 0.167
Distribution of Scores
Height of Adults
Mean = 69 inches (original units) = 0 (z-score units OR standard deviation units)
Standard deviation = + 3 inches
3 standard deviations from mean
o 0.13% of the pop.
Probability
Proportion of the total area under the curve for particular scores equals the probability of
those scores
1.96
Sampling Error
Sampling Distribution of Means
o Measure many samples with 100 male University students in each sample
Assumption
o Samples are randomly selected and valid representations of the population
Sampling Error = x̄ - µ
o The larger the error, the less accurate the sample represents the pop.
The sample must be “different”
As n increases, variability (σX̅) from mean is reduced
n = sample size
σX̅ = σ / √n
o Standard error of the mean
Birth Weights
o Lots of samples (thousands), with 10 babies in each sample
n = 10
o s X̅ = s / √n
o s X̅ = 30 / √10
o s X̅ = 9.5lbs
, 1. More samples had a sample mean = to pop. mean
2. More samples have means that are closer to the pop. mean
Central Limit Theorem
o Sampling distributions of means always:
1. Forms an approximately normal distribution
2. Has a sample mean equal to the population mean (μ) from which it was
created
3. Has a standard deviation that is mathematically related to the standard
deviation of the raw score pop.
o Standard error of the mean (X̅) is a function of standard deviation & sample size
X̅ = / √n
Confidence Intervals
Range of sample data to determine a range of population means that are NOT
significantly different from the sample mean
Point Estimate
o A single value obtained directly from sample data (mean)
Interval Estimate
o Range of sample data that we suspect (with a degree of confidence) within which
the population mean resides
Confidence Intervals (CI)
o Range of scores with specific boundaries (confidence limits), that should contain
the population mean
o Not a single value!
o CI = x̄ (z) sX̅
x̄ = sample mean
z = z-score (need %)
sX̅ = standard error of the mean
Confidence Intervals
Developing a confidence interval
Standard levels of confidence: 95% OR 99% (not both)
Example: Use 95% confidence level
o Capture 95% of area under the “normal” distribution
o This occurs at a standard deviation (z) of 1.96
o Find: sample mean, and standard error of the mean
o 5% chance that the pop. mean is not in the interval
What if the sample size is “small”?
o Usually performed with samples smaller than 30
o Use the t-distribution, not z-distribution
Why
Variability decreases with larger sample sizes
T-distribution curves more platykurtic
T-distribution depends on sample size