INDU 6331 Assignment 5 Advanced Quality Control
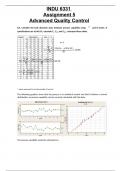
Consider the hole diameter data. Estimate process capability using ´x and R charts. If specifications are at 0±0.01, calculate Cp, Cpk, and Cpkm. Interpret these ratios. n= 5 ´x= ∑ ´x m = (8+0+…+20+18) 20 =10,90 R´ = ∑Ri m = (80+110+…+60+50) 20 =63,50 σ^= R´ d2 = 63,50 2.326 =27,3 * values expressed in ten-thousandths of an inch The following graphics show that the process is in statistical control and that it follows a normal distribution, so process capability can be correctly calculated with this data. The process capability would be estimated as: INDU 6331 Assignment 5 Advanced Quality Control ´x±3 σ^=10,90 ±3 (27,3)=10,90± 81,9 Without considering specifications, we can estimate that approximately 99,73% of the deviations from nominal diameter for holes will be between -71,0 and 92,8 ten-thousandths of an inch. Considering specifications 0±0.01 inch USL= 0.01 LSL= -0.01 σ^ = 27.3 ten-thousand of an inch= 0,00273 ´x = 10,9 ten-thousand of an inch= 0,00109 C^ p= USL−LSL 6 σ^ = 0,01−(−0,01) 6(0,00273) =1,22 Assuming that the process is centered, the ratio of capability Cp= 1,22 (1) means that the process has a good performance, so it will be expected a low level of nonconformances. C^ pu= USL−´x 3 σ^ = 0,01−(0,00109) 3(0,00273) =1,09 C^ pl= ´x−LSL 3σ^ = 0,00109−(−0.01) 3(0,00273) =1,35 C^ pk=min(C^ pu ,C^ pl)=1,09 There is a difference between Cp= 1,22 and Cpk= 1,09. This means that the process mean is not centered in the specification limits. Considering the off-centering of the process, the capability is Cpk= 1,09 (1) and its value shows that it can be still considered with good performance (not many nonconformances will be expected). T= 1 2 (USL+LSL)= 1 2 (0.01−0.01)=0 C^ pkm= Cpk √1+( x´−T σ^ ) 2 = 1,09 √1+( 0,00109−0 0,00273 ) 2 =1,01 The value of Cpk alone is not a good indicator of centering because it can be affected by σ, that is why is needed to compare it with the value of Cp. Another indicator that is useful to check capability of an off-centering process is Cpkm. Considering the shift of the mean from the Target of the specification limits, the value of the capability indicator Cpkm is 1,01 (1). This value is still greater than 1, so it can be assumed that the process has good performance. 8.5. A process is in control with ´x = 100, ´s = 1.05, and n= 5. The process specifications are at 95±10. The quality characteristic has a normal distribution. a. Estimate the potential capability n= 5 ´x = 100 σ^= ´S c4 = 1,05 0,94 =1,12 USL= 105 LSL= 85 C^ p= USL−LSL 6 σ^ = 105−85 6(1,12) =2,98 The potential capability is Cp= 2,98. Assuming that the process is centered, having the capability ratio Cp greater than 1 means that a low level of nonconformances is expected in the process. b. Estimate the actual capability
Written for
- Institution
- INDU 6331
- Course
- INDU 6331
Document information
- Uploaded on
- June 25, 2023
- Number of pages
- 15
- Written in
- 2022/2023
- Type
- Exam (elaborations)
- Contains
- Questions & answers
Subjects
-
indu
-
indu 6331
-
assignment 5
-
questions and answers
-
advanced quality control
Document also available in package deal