Exercises
Thursday, 21 July 2022 07:15
20.07.2022
1. The narrow unemployment rate: 7 862 776 000 = 0,3452 = 34,52%
2. The narrow participation rate: 22 776 033 000 = 0,5689 = 56,89%
3. The employment rate: 14 914 033 000 = 0,3725 = 37,25%
Clicker discussion
q. Why can the unemployment rate never be 0% even when the labour market is in equilibrium?
a. Efficiency wages and reservation wages must be paid.
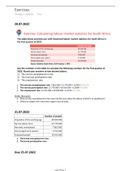
21.07.2022
Number of people
Population of the working age 40 033 000
Narrow labour force 22 776 000
Narrowly unemployed 7 862 000
Discouraged work-seekers 3 752 000
Employed people 14 914 000
1. The broad unemployment rate:
2. The broad participation rate:
Due 25.07.2022
Unit 9 Page 1
,Unit 9 Page 2
, A. False. If there is cut in the unemployment benefit would shift the best response function to the
left [wage level lower + wage level lower] and shift downwards in the wage-setting curve.
B. False. If the expected period of unemployment increased, it would shift the best response curve
to the left which means the wage setting curve will be lower.
C. True. There is less utility to the unemployed, more utility to the employed. Shift downwards on
the wage-setting curve.
D. False. Fewer people in market, supply of labour decrease, and price of labour increase. More
people leaving, fewer in labour force, higher bargaining power, shift right wards, firms have to
compensate, wage-setting curve will shift up.
Clicker question 27.7.2022
A. The wage-setting curve shows the real wage necessary at each level of economy-wide
employment to provide workers with incentives to work hard and well.
B. The nominal wage represents what workers can actually buy with their money and accounts for
inflation.
C. Average product of labour = real profit per worker + real wage per worker.
D. The price-setting curve shows the price at each level of economy-wide employment where firms
max profit.
Unit 9 Page 3
Thursday, 21 July 2022 07:15
20.07.2022
1. The narrow unemployment rate: 7 862 776 000 = 0,3452 = 34,52%
2. The narrow participation rate: 22 776 033 000 = 0,5689 = 56,89%
3. The employment rate: 14 914 033 000 = 0,3725 = 37,25%
Clicker discussion
q. Why can the unemployment rate never be 0% even when the labour market is in equilibrium?
a. Efficiency wages and reservation wages must be paid.
21.07.2022
Number of people
Population of the working age 40 033 000
Narrow labour force 22 776 000
Narrowly unemployed 7 862 000
Discouraged work-seekers 3 752 000
Employed people 14 914 000
1. The broad unemployment rate:
2. The broad participation rate:
Due 25.07.2022
Unit 9 Page 1
,Unit 9 Page 2
, A. False. If there is cut in the unemployment benefit would shift the best response function to the
left [wage level lower + wage level lower] and shift downwards in the wage-setting curve.
B. False. If the expected period of unemployment increased, it would shift the best response curve
to the left which means the wage setting curve will be lower.
C. True. There is less utility to the unemployed, more utility to the employed. Shift downwards on
the wage-setting curve.
D. False. Fewer people in market, supply of labour decrease, and price of labour increase. More
people leaving, fewer in labour force, higher bargaining power, shift right wards, firms have to
compensate, wage-setting curve will shift up.
Clicker question 27.7.2022
A. The wage-setting curve shows the real wage necessary at each level of economy-wide
employment to provide workers with incentives to work hard and well.
B. The nominal wage represents what workers can actually buy with their money and accounts for
inflation.
C. Average product of labour = real profit per worker + real wage per worker.
D. The price-setting curve shows the price at each level of economy-wide employment where firms
max profit.
Unit 9 Page 3