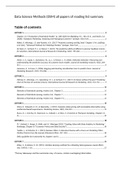
SPSS Examination Summary
Exam: 24.06.22 @ 11:00 - 12:00
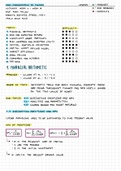
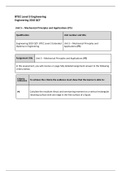
X1 , X2 Y Technique
Interval Interval MRA
Nominal Interval ANOVA
Nominal X + Interval C Interval ANCOVA
Interval Binary LRA
Week 1: Multiple Regression Analysis (MRA)
MRA = if A is regressed on B, A is the dependent variable and B the predictor/independent
→ Y is regressed on X
Calculate Pearson Correlation
Analyse → correlate → bivariate → add variables needed → check
Pearson
Does it make sense to perform a linear regression?
If there is a relationship = yes!
Which variable is likely to be a good predictor?
Highest significance = good predictor
Perform Linear Regression
Analyse → regression → linear → add what is needed (also if they ask
for extras)
Can the null hypothesis be rejected?
Look at the ANOVA table → it if is significant (p < 0.05) reject the
H0
What predictor explains the most unique variance?
, Look at the coefficients table → look at "part" → do each X 2 and check the
highest value
Example: 0.4872 = 0.237 → do for each: if this is the highest, then this
is the most unique
Is there evidence of multicollinearity in the predictors?
Look at VIF ( should be lower than 10) and Tolerance (should be higher than 0.10)
→ if they are lower than 10 and higher than 0.10 = no
multicollinearity (good thing!)
Do Cook's distances and Leverage values suggest the presence of outliers?
Look at Cook's (should be lower than 1) and Leverage (should be less than 3(k+1)/N)
● K = number of predictors/variables
Compare these values to the maximum in the table
Get rid of outliers (if needed)
Data → select cases → "if condition is satisfied" → put in what needs
to be gone (so this could be Cooks < 1 and/or Leverage < 3(k+1)/N)
How much variance is explained by..?
R2 = total variance explained, given in model summary table → unique
variance explained is part2
→ R2 is given under one of the tables, do not have to calculate it
Is there evidence of non-linearity, heteroscedasticity or non-normality of the residuals?
Scatterplot of standardised predicted values vs standardised residuals
Within linear regression: plots → full in Y: ZRESID and X: ZPRED →
check normal probability plot
What is the estimated regression equation? Interpret the regression coefficient
Yi = b0 + b1x1 + b2x2 + … → fill in the data and interpret the significance
(p < 0.05)
Week 2: Analysis of Variance (ANOVA)
Make a cross tabulation of X and Y
Exam: 24.06.22 @ 11:00 - 12:00
X1 , X2 Y Technique
Interval Interval MRA
Nominal Interval ANOVA
Nominal X + Interval C Interval ANCOVA
Interval Binary LRA
Week 1: Multiple Regression Analysis (MRA)
MRA = if A is regressed on B, A is the dependent variable and B the predictor/independent
→ Y is regressed on X
Calculate Pearson Correlation
Analyse → correlate → bivariate → add variables needed → check
Pearson
Does it make sense to perform a linear regression?
If there is a relationship = yes!
Which variable is likely to be a good predictor?
Highest significance = good predictor
Perform Linear Regression
Analyse → regression → linear → add what is needed (also if they ask
for extras)
Can the null hypothesis be rejected?
Look at the ANOVA table → it if is significant (p < 0.05) reject the
H0
What predictor explains the most unique variance?
, Look at the coefficients table → look at "part" → do each X 2 and check the
highest value
Example: 0.4872 = 0.237 → do for each: if this is the highest, then this
is the most unique
Is there evidence of multicollinearity in the predictors?
Look at VIF ( should be lower than 10) and Tolerance (should be higher than 0.10)
→ if they are lower than 10 and higher than 0.10 = no
multicollinearity (good thing!)
Do Cook's distances and Leverage values suggest the presence of outliers?
Look at Cook's (should be lower than 1) and Leverage (should be less than 3(k+1)/N)
● K = number of predictors/variables
Compare these values to the maximum in the table
Get rid of outliers (if needed)
Data → select cases → "if condition is satisfied" → put in what needs
to be gone (so this could be Cooks < 1 and/or Leverage < 3(k+1)/N)
How much variance is explained by..?
R2 = total variance explained, given in model summary table → unique
variance explained is part2
→ R2 is given under one of the tables, do not have to calculate it
Is there evidence of non-linearity, heteroscedasticity or non-normality of the residuals?
Scatterplot of standardised predicted values vs standardised residuals
Within linear regression: plots → full in Y: ZRESID and X: ZPRED →
check normal probability plot
What is the estimated regression equation? Interpret the regression coefficient
Yi = b0 + b1x1 + b2x2 + … → fill in the data and interpret the significance
(p < 0.05)
Week 2: Analysis of Variance (ANOVA)
Make a cross tabulation of X and Y