22) Refer to Table 2-4. Assume that 2016 is used as the base year, with the index number = 100. The value
of the index number in 2012 is
A) 0.818.
B) 1.0.
C) 1.222.
D) 81.8.
E) 122.2.
Answer: D
Diff: 3
Topic: 2.3a. index numbers
Skill: Applied
User1: Table
User2: Quantitative
23) Refer to Table 2-4. The increase in the price of the textbook from 2012 to 2016 is
A) -40.
B) 40.
C) 18.2%.
D) 22.2%.
E) 40%.
Answer: D
Diff: 3
Topic: 2.3a. index numbers
Skill: Applied
User1: Table
User2: Quantitative
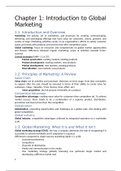
, The table below shows hypothetical data for the volume of gold and nickel output across several years.
Gold Index Nickel Index
(troy ounces) (lbs)
Year 1 1 230 000 4500
Year 2 1 416 000 4551
Year 3 1 349 000 100 4623 100
Year 4 947 000 4791
Year 5 1 012 000 4802
Year 6 1 321 000 4867
Year 7 1 450 000 5002
Year 8 1 510 000 5117
TABLE 2-5
24) Refer to Table 2-5. What is the index number for gold output in Year 1?
A) 0.91
B) 109.7
C) 1.097
D) 91.2
E) 99.7
Answer: D
Diff: 3
Topic: 2.3a. index numbers
Skill: Applied
Learning Obj.: 2-4 Identify several types of economic data, including index numbers, time‐series and cross‐sectional
data, and scatter diagrams.
User1: Table
User2: Quantitative
25) Refer to Table 2-5. What is the index number for gold output in Year 8?
A) 111.9
B) 111.9%
C) 11.9
D) 11.9%
E) 1.119
Answer: A
Diff: 3
Topic: 2.3a. index numbers
Skill: Applied
Learning Obj.: 2-4 Identify several types of economic data, including index numbers, time‐series and cross‐sectional
data, and scatter diagrams.
User1: Table
User2: Quantitative
of the index number in 2012 is
A) 0.818.
B) 1.0.
C) 1.222.
D) 81.8.
E) 122.2.
Answer: D
Diff: 3
Topic: 2.3a. index numbers
Skill: Applied
User1: Table
User2: Quantitative
23) Refer to Table 2-4. The increase in the price of the textbook from 2012 to 2016 is
A) -40.
B) 40.
C) 18.2%.
D) 22.2%.
E) 40%.
Answer: D
Diff: 3
Topic: 2.3a. index numbers
Skill: Applied
User1: Table
User2: Quantitative
, The table below shows hypothetical data for the volume of gold and nickel output across several years.
Gold Index Nickel Index
(troy ounces) (lbs)
Year 1 1 230 000 4500
Year 2 1 416 000 4551
Year 3 1 349 000 100 4623 100
Year 4 947 000 4791
Year 5 1 012 000 4802
Year 6 1 321 000 4867
Year 7 1 450 000 5002
Year 8 1 510 000 5117
TABLE 2-5
24) Refer to Table 2-5. What is the index number for gold output in Year 1?
A) 0.91
B) 109.7
C) 1.097
D) 91.2
E) 99.7
Answer: D
Diff: 3
Topic: 2.3a. index numbers
Skill: Applied
Learning Obj.: 2-4 Identify several types of economic data, including index numbers, time‐series and cross‐sectional
data, and scatter diagrams.
User1: Table
User2: Quantitative
25) Refer to Table 2-5. What is the index number for gold output in Year 8?
A) 111.9
B) 111.9%
C) 11.9
D) 11.9%
E) 1.119
Answer: A
Diff: 3
Topic: 2.3a. index numbers
Skill: Applied
Learning Obj.: 2-4 Identify several types of economic data, including index numbers, time‐series and cross‐sectional
data, and scatter diagrams.
User1: Table
User2: Quantitative