Week 1
Simple Linear Regression Model
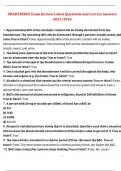
- Suppose that Y is a linear function of another variable X, with unknown parameters
beta1 and beta 2.
- Suppose that we have a sample of 4 observations with X values (as shown)
- If the relationship were an exact one, the 4 observations would lie on the straight
line (and we would have no trouble with obtaining the estimates of beta1 and
beta2). But in practice, this does not happen à the observations lie around the
straight line. à hence the values of Y are different than the values (of Y) on the
straight line
à To allow for such divergence, we will write the regression model as 𝑌 = 𝛽! + 𝛽" 𝑋 +
𝑢 , where u is the disturbance term
o Why does the disturbance term exist?
1. Omission of explanatory variables
2. Aggregation of variables
3. Measurement error
4. Model & functional misspecification
à Each value of Y exists of a nonrandom component, 𝛽! + 𝛽" 𝑋, and a random component
u.
Estimating a linear regression model
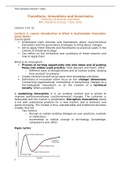
- We now use 𝑌( = 𝛽)! + 𝛽)" 𝑋, where 𝛽)! is an estimate of 𝛽! and 𝛽)" is an estimate of
𝛽" .
, - The line is called the fitted model and the values of Y predicted by it are called the
fitted values of Y (the R points).
- The discrepancies of the actual and the fitted values of Y are known as the residuals
(𝑢*).
Difference between u and 𝑢*
- This figure shows the disturbance term, u (difference between nonrandom
component and the actual observation).
, - This figure shows the residual, 𝑢* (difference between actual and fitted values).
Least Squares Criterion
Minimize RSS (residual sum of squares), where
$
𝑅𝑆𝑆 = / 𝑢*#" = 𝑢*!" + ⋯ + 𝑢*$"
#%!
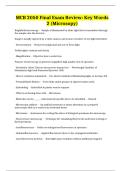
à Draw the fitted line so as to minimize the sum of the squares of the residuals (RSS). à
Least squares criterion
- The aim is to fit the regression line: draw the fitted line so as to minimize sum of the
squared of residuals, RSS
- A least squares analysis begins with a set of data points plotted on a graph.
Independent variables are plotted on the horizontal x-axis while dependent variables
are plotted on the vertical y-axis. The analyst uses the least squares formula to
determine the most accurate straight line that will explain the relationship between
an independent variable and a dependent variable.
- We take the squares of the residuals because otherwise we would get a perfect fit
(horizontal line) à the sum of the residuals would be zero. To prevent this, we
should cancel out the negative values à this can be done by taking the squares of
the residuals.
Deriving Linear Regression Coefficients
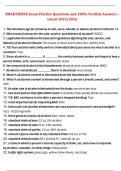
1$ = 𝑌$ − 3
Calculating the residual: 𝑢 𝑌$
, à The values of Y1 (4), Y2 (3), Y3 (5) en Y4 (8), you can read from the Y axis.
à The values of 3𝑌$ (b1 and b2) we are going to estimate
Use partial derivatives:
- In order to calculate b1 and b2, set the equations equal to 0.
à 8b1 + 20b2 – 40 = 20b1 + 60b2 – 114 = 0
B1 = -3.333b2 + 6.166
à fill this in in the b2 formula
- We could name these values 𝐵 3! OLS and 𝐵
3" OLS to emphasize that these are the
particular values that satisfy the OLS criterion.
Derivation of Linear regression coefficients – General case with n observations
𝑏1 = 𝑌7 − 𝑏" 𝑋7
∑(𝑋# − 𝑋7)(𝑌# − 𝑌7)
𝑏2 =
∑(𝑋# − 𝑋7)"
Simple Linear Regression Model
- Suppose that Y is a linear function of another variable X, with unknown parameters
beta1 and beta 2.
- Suppose that we have a sample of 4 observations with X values (as shown)
- If the relationship were an exact one, the 4 observations would lie on the straight
line (and we would have no trouble with obtaining the estimates of beta1 and
beta2). But in practice, this does not happen à the observations lie around the
straight line. à hence the values of Y are different than the values (of Y) on the
straight line
à To allow for such divergence, we will write the regression model as 𝑌 = 𝛽! + 𝛽" 𝑋 +
𝑢 , where u is the disturbance term
o Why does the disturbance term exist?
1. Omission of explanatory variables
2. Aggregation of variables
3. Measurement error
4. Model & functional misspecification
à Each value of Y exists of a nonrandom component, 𝛽! + 𝛽" 𝑋, and a random component
u.
Estimating a linear regression model
- We now use 𝑌( = 𝛽)! + 𝛽)" 𝑋, where 𝛽)! is an estimate of 𝛽! and 𝛽)" is an estimate of
𝛽" .
, - The line is called the fitted model and the values of Y predicted by it are called the
fitted values of Y (the R points).
- The discrepancies of the actual and the fitted values of Y are known as the residuals
(𝑢*).
Difference between u and 𝑢*
- This figure shows the disturbance term, u (difference between nonrandom
component and the actual observation).
, - This figure shows the residual, 𝑢* (difference between actual and fitted values).
Least Squares Criterion
Minimize RSS (residual sum of squares), where
$
𝑅𝑆𝑆 = / 𝑢*#" = 𝑢*!" + ⋯ + 𝑢*$"
#%!
à Draw the fitted line so as to minimize the sum of the squares of the residuals (RSS). à
Least squares criterion
- The aim is to fit the regression line: draw the fitted line so as to minimize sum of the
squared of residuals, RSS
- A least squares analysis begins with a set of data points plotted on a graph.
Independent variables are plotted on the horizontal x-axis while dependent variables
are plotted on the vertical y-axis. The analyst uses the least squares formula to
determine the most accurate straight line that will explain the relationship between
an independent variable and a dependent variable.
- We take the squares of the residuals because otherwise we would get a perfect fit
(horizontal line) à the sum of the residuals would be zero. To prevent this, we
should cancel out the negative values à this can be done by taking the squares of
the residuals.
Deriving Linear Regression Coefficients
1$ = 𝑌$ − 3
Calculating the residual: 𝑢 𝑌$
, à The values of Y1 (4), Y2 (3), Y3 (5) en Y4 (8), you can read from the Y axis.
à The values of 3𝑌$ (b1 and b2) we are going to estimate
Use partial derivatives:
- In order to calculate b1 and b2, set the equations equal to 0.
à 8b1 + 20b2 – 40 = 20b1 + 60b2 – 114 = 0
B1 = -3.333b2 + 6.166
à fill this in in the b2 formula
- We could name these values 𝐵 3! OLS and 𝐵
3" OLS to emphasize that these are the
particular values that satisfy the OLS criterion.
Derivation of Linear regression coefficients – General case with n observations
𝑏1 = 𝑌7 − 𝑏" 𝑋7
∑(𝑋# − 𝑋7)(𝑌# − 𝑌7)
𝑏2 =
∑(𝑋# − 𝑋7)"