6C and D for Caleb Watson
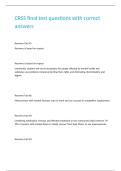
The student has conducted his research and has concluded. He has produced a set of results and has
demonstrated practical skills during the experiment in a lab setting.
x Water / Caffeine Caffeine Caffeine Ethanol Ethanol Ethanol Dates and
Normal at 0.25% at 0.5% at at at 2.5% at 5% Room
heartbea [bpm] [bpm] 0.75% 1.25% [bpm] [bpm] Temp.
t[bpm] [bpm] [bpm]
Daphn 296 298 x x x x x 14/3/2022
ia #1 19
Daphn 276 x 312 x x x x 14/3/2022
ia #2 21
Daphn 280 x x 501 x x x 15/3/2022
ia #3 19
Daphn 279 x x 346 x x x 16/3/2022
ia #4 20
Daphn 299 x x x 278 x x 24/3/2022
ia #5 23
Daphn 303 x x x x 242 x 24/3/2022
ia #6 22
Daphn 286 x x x x x 199 25/3/2022
ia #7 22
Daphn 293 x x x x x 221 30/3/2022
ia #8 21
__ = An outlier/anomaly
X = N/A
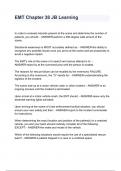
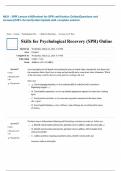
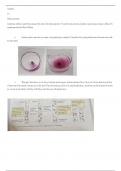
Pictures from the experiment:
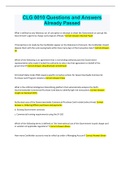
Secondary data:
The secondary data is the data the student has acquired by a lab partner who conducted the same
experiment as me but produced different results. This set of data can be used to calculate our t test
equation, while compares two sets of statistical data against each other. Here are pictures of the
secondary data he has procured from a lab partner:
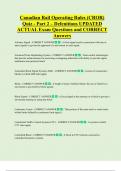
, T-test:
The formula for a T-test is shown above, with is the formula that the student will be using to
compare his data with secondary data. The t test will be difficult to perform as I have not collected
enough data to calculate a proper mean. However, the t-test can show differences in data, and label
whether they are significant or not. Here are pictures of the calculations for ethanol:
Analysis of the student’s results:
The consistent results show a correlation between a dosage of caffeine, with a concentration as little
as 0.25%, and an elevation in the heartbeat of a daphnia. The results also show a correlation
between a dosage of ethanol, with a concentration as little as 1.25%, and a depression in the
heartbeat of a daphnia. This is clear when looking at the drawn graph for the student’s primary data
as the graphs have a steady incline for caffeine and a steady decline for ethanol. This coincides with
the student’s hypothesis and literature review findings. The data that is present in the student’s
literature review aligns with the student’s primary data. This is a major positive of his findings as this
makes his findings more accuracy and viable against secondary and tertiary data.
One factor that did not change noticeably enough to affect the heartbeat of the daphnia is the
temperature of the room. The student performed well in his result-taking by recording the
temperature of the room every day of experimentation, allowing him to potentially give a reason as
to why a daphnia may have an abnormal heartbeat. This is good laboratory practice.
After conducting research on Daphnia, the student has produced a table of results after 6 separate
days of experimentation. As stated in 6B, he only used one daphnia for one concentration of a
substance. No daphnia were experimented on twice, to the student’s knowledge.
The accuracy of the student’s data could have been improved by using a different method of
collecting data. One example is the fact that the student could have recorded 60 seconds worth of
footage of the daphnia’s heartbeat, instead of only recording 15 seconds and multiplying that figure
by 4. This would improve the accuracy of the results as there could be anomalies in the heartbeat
The student has conducted his research and has concluded. He has produced a set of results and has
demonstrated practical skills during the experiment in a lab setting.
x Water / Caffeine Caffeine Caffeine Ethanol Ethanol Ethanol Dates and
Normal at 0.25% at 0.5% at at at 2.5% at 5% Room
heartbea [bpm] [bpm] 0.75% 1.25% [bpm] [bpm] Temp.
t[bpm] [bpm] [bpm]
Daphn 296 298 x x x x x 14/3/2022
ia #1 19
Daphn 276 x 312 x x x x 14/3/2022
ia #2 21
Daphn 280 x x 501 x x x 15/3/2022
ia #3 19
Daphn 279 x x 346 x x x 16/3/2022
ia #4 20
Daphn 299 x x x 278 x x 24/3/2022
ia #5 23
Daphn 303 x x x x 242 x 24/3/2022
ia #6 22
Daphn 286 x x x x x 199 25/3/2022
ia #7 22
Daphn 293 x x x x x 221 30/3/2022
ia #8 21
__ = An outlier/anomaly
X = N/A
Pictures from the experiment:
Secondary data:
The secondary data is the data the student has acquired by a lab partner who conducted the same
experiment as me but produced different results. This set of data can be used to calculate our t test
equation, while compares two sets of statistical data against each other. Here are pictures of the
secondary data he has procured from a lab partner:
, T-test:
The formula for a T-test is shown above, with is the formula that the student will be using to
compare his data with secondary data. The t test will be difficult to perform as I have not collected
enough data to calculate a proper mean. However, the t-test can show differences in data, and label
whether they are significant or not. Here are pictures of the calculations for ethanol:
Analysis of the student’s results:
The consistent results show a correlation between a dosage of caffeine, with a concentration as little
as 0.25%, and an elevation in the heartbeat of a daphnia. The results also show a correlation
between a dosage of ethanol, with a concentration as little as 1.25%, and a depression in the
heartbeat of a daphnia. This is clear when looking at the drawn graph for the student’s primary data
as the graphs have a steady incline for caffeine and a steady decline for ethanol. This coincides with
the student’s hypothesis and literature review findings. The data that is present in the student’s
literature review aligns with the student’s primary data. This is a major positive of his findings as this
makes his findings more accuracy and viable against secondary and tertiary data.
One factor that did not change noticeably enough to affect the heartbeat of the daphnia is the
temperature of the room. The student performed well in his result-taking by recording the
temperature of the room every day of experimentation, allowing him to potentially give a reason as
to why a daphnia may have an abnormal heartbeat. This is good laboratory practice.
After conducting research on Daphnia, the student has produced a table of results after 6 separate
days of experimentation. As stated in 6B, he only used one daphnia for one concentration of a
substance. No daphnia were experimented on twice, to the student’s knowledge.
The accuracy of the student’s data could have been improved by using a different method of
collecting data. One example is the fact that the student could have recorded 60 seconds worth of
footage of the daphnia’s heartbeat, instead of only recording 15 seconds and multiplying that figure
by 4. This would improve the accuracy of the results as there could be anomalies in the heartbeat