Quantitative Data Analysis 2
Lecture 1a
Terminology:
OV = Outcome variable / DV = Dependent Variable > Test variable, variable to be explained.
PV = Predictor Variable / IV = Independent Variable > variable that explains
The p-value = stand for the probability of obtaining a result (or test-statistic value) equal to (or ‘more
extreme’ than) what was actually observed (the result you actually got), assuming that the null
hypothesis is true. A low p-value indicates that the null hypothesis is unlikely.
A conceptual model is a visual representation of relations between theoretical constructs (and
variables) of interest (simplified description of reality).
Measurement scales of variables:
- Categorical (nominal, ordinal) > subgroups are indicated by numbers
- Quantitative (discrete, interval, ratio) > we use numerical scales, with equal distances
between values
o In social sciences we sometimes treat ordinal scales as (pseudo) interval scales
(e.g. Likert scales)
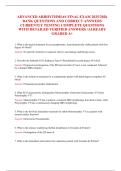
Moderation/interaction = what if our proposed effect is stronger in certain settings?
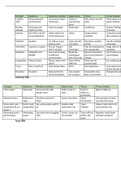
Mediation = what if the proposed relationship ‘goes via’ another variable?
Analysis of variance –> ANOVA
When do we use it?
- OV = quantitative > so we can run tests on the mean
- PV = categorical
o Number of categories is 2 or more
o Participants = different
▪ Independent, mutually exclusive samples
Further assumptions:
- Variance is homogeneous across groups
- Residuals are normally distributed
- Groups are roughly equally sized
ANOVA and F-test
,H0 = no difference in OV mean across the different categories in PV
H1 = there is at least one difference in OV mean score between PV categories
Test statistic: F-test
- F-distribution looks different than t-distribution
- F-values are looking to explain variability
ANOVA decomposes total variability observed in OV (DV):
- How much is caused by differences between groups (explained)?
- How much is caused by differences within groups (unexplained)?
Variance = the average of the squared differences from the Mean (average)
Sum of Squares = the sum of the squared differences from the Mean
(average)
- Total Sum of Squares = squared deviations from grand overall mean and total variability to
be explained.
- Residual Sum of Squares = The residuals that remain in each group > squared deviations
observations from group means
R2 = the proportion of the total variance in our data that is ‘explained’ by our model. Rs is an
important and valuable indication, but not a ‘formal’ statistical test. To investigate if the group
means differ with an ANOVA, we do an F-test. This is a statistical test and thus checks the ratio
explained variability to unexplained variability.
We cannot divide the model sum of squares by the residual sum of squares > not based on same
number of observations. We therefore divide by the degrees of freedom and get the ‘mean square’.
DFmodel = k – 1 > k is number of groups
DFresidual = n – k
, F-ratio has a null hypothesis and an alternative hypothesis. And as any test statistic, it has an
accompanying p-value. From F-ratio to p-value: depends on df > based on p-value, conclusion on H0.
ANOVA in SPSS
Lecture 1a
Terminology:
OV = Outcome variable / DV = Dependent Variable > Test variable, variable to be explained.
PV = Predictor Variable / IV = Independent Variable > variable that explains
The p-value = stand for the probability of obtaining a result (or test-statistic value) equal to (or ‘more
extreme’ than) what was actually observed (the result you actually got), assuming that the null
hypothesis is true. A low p-value indicates that the null hypothesis is unlikely.
A conceptual model is a visual representation of relations between theoretical constructs (and
variables) of interest (simplified description of reality).
Measurement scales of variables:
- Categorical (nominal, ordinal) > subgroups are indicated by numbers
- Quantitative (discrete, interval, ratio) > we use numerical scales, with equal distances
between values
o In social sciences we sometimes treat ordinal scales as (pseudo) interval scales
(e.g. Likert scales)
Moderation/interaction = what if our proposed effect is stronger in certain settings?
Mediation = what if the proposed relationship ‘goes via’ another variable?
Analysis of variance –> ANOVA
When do we use it?
- OV = quantitative > so we can run tests on the mean
- PV = categorical
o Number of categories is 2 or more
o Participants = different
▪ Independent, mutually exclusive samples
Further assumptions:
- Variance is homogeneous across groups
- Residuals are normally distributed
- Groups are roughly equally sized
ANOVA and F-test
,H0 = no difference in OV mean across the different categories in PV
H1 = there is at least one difference in OV mean score between PV categories
Test statistic: F-test
- F-distribution looks different than t-distribution
- F-values are looking to explain variability
ANOVA decomposes total variability observed in OV (DV):
- How much is caused by differences between groups (explained)?
- How much is caused by differences within groups (unexplained)?
Variance = the average of the squared differences from the Mean (average)
Sum of Squares = the sum of the squared differences from the Mean
(average)
- Total Sum of Squares = squared deviations from grand overall mean and total variability to
be explained.
- Residual Sum of Squares = The residuals that remain in each group > squared deviations
observations from group means
R2 = the proportion of the total variance in our data that is ‘explained’ by our model. Rs is an
important and valuable indication, but not a ‘formal’ statistical test. To investigate if the group
means differ with an ANOVA, we do an F-test. This is a statistical test and thus checks the ratio
explained variability to unexplained variability.
We cannot divide the model sum of squares by the residual sum of squares > not based on same
number of observations. We therefore divide by the degrees of freedom and get the ‘mean square’.
DFmodel = k – 1 > k is number of groups
DFresidual = n – k
, F-ratio has a null hypothesis and an alternative hypothesis. And as any test statistic, it has an
accompanying p-value. From F-ratio to p-value: depends on df > based on p-value, conclusion on H0.
ANOVA in SPSS