Statistics for premasters DSS
Exam: multiple choice 80% of the grade. 20% from 6 assignments, complete or incomplete
no extensions. Complete 5/6 for full score.
Lecture 1
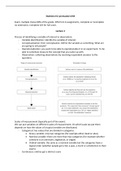
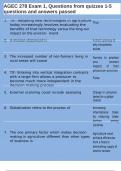
Process of identifying a variable of interest to observation:
- Variable identification: identify the variable of interest.
- Conceptualization: then conceptualize. Define the variable as something. What are
you going to ask people?
- Operationalization: you want to be able to operationalize it in an experiment. To be
able to somehow measure the concept that you came up with.
- Observation: collecting observations by receiving respondent answers to the
questions.
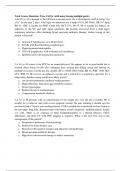
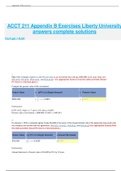
Scales of measurement (typically part of the exam):
We can put variables on different scales of measurement. On which scale we put them
depends on how the values of a typical variable are distributed.
- Categorical: has values that are divided in categories.
• binary variable: only two categories (for example either dead or alive)
• Nominal variable: there are more than two categories (for example whether
someone is an omnivore, vegetarian, or vegan)
• Ordinal variable: the same as a nominal variable but the categories have a
logical order (whether people got a fail, a pass, a merit or a distinction in their
exam).
- Continuous: entities get a distinct score
, • Interval variable: equal intervals on the variable represent equal differences
in property being measured (for example the difference between 6 and 8 is
equivalent to the difference between 13 and 15).
• Ratio variable: the same as an interval variable, but the ratios of scores on
the scale must also make sense and have true 0 value (for example a score of
16 on an anxiety scale means that the person is, in reality, twice as anxious as
someone scoring 8). Here the difference between the score of 2 and 4 is still
equivalent to the difference between 8 and 10. However, there is a true 0
value, where 0 means no anxiety. The ratios also make sense.
For example, the difference between 18 and 16 is the same as the difference between 18
and 20 for temperature. However, temperature does not have a true 0 value. 0 does not
mean that there is no temperature. On top of that, 20 degrees is not twice as warm as 10
degrees (because on Fahrenheit scale they are not going to be double of each other).
Therefore, temperature is measured on an interval scale.
Reliability of our measures:
- Reliability: the ability of the measure to produce the same results under the same
condition.
- Test-retest reliability: the ability of a measure to produce consistent results when
the same entities are tested at two different points in time.
- Inter-rater reliability: consistency across people. Do they produce the same answer?
- Parallel form reliability: do different measures that are supposed to measure the
same thing actually measure the same? (Two different eye trackers).
- Internal consistency reliability: do things that are supposed to measure the same
thing actually measure it? (Multiple questions measuring IQ). Do they both measure
IQ to the same extend?
Some variable terminology:
- One that talks about something that has to be explained, depended variable,
outcome.
- The variable that does the explaining, independent variable, predictor.
Common types of research:
- Correlational research: observing what naturally goes on in the world without
directly interfering with it. So, looking at what is going on in the world and drawing
conclusions, but not actually run an experiment or interfere in a direct manner.
- Cross-sectional research: data come from people at different age points with
different people representing each age point. Could be quasi-experimental, case
study, naturalistic observation.
, - Experimental research: one or more variable systematically manipulated to see their
effect (alone or in combination) on an outcome variable. Randomization (random
assignment, random sampling, etc.) statements can often be made about cause and
effect. This is the most important research in the field of data science.
Problems in experimental research:
- Confounds: an unmeasured variable that could be related to the variable of interest.
For example, if you measured the difference in IQ between women and men in the
1920’s. You would conclude that man have a higher IQ. However, this does not come
from the gender, but from the education.
- Artefacts: something that might threaten the external validity or construct validity of
your results (e.g. movement noise in an EEG signal). You see very big jumps in EG
signals. They are not brain activity. This is what happens when you blink. This might
influence what you are trying to measure.
Types of validity:
- Internal validity: the extent to which you are able to draw the correct conclusions
about the casual relationships between variables. So, did you set up your experiment
in such a way that you can draw conclusions about the influence of the dependent
variable on the independent variable.
- External validity: the generalizability of your findings. To what extend do you expect
to see the same pattern of results in “real life” as you saw in your study.
- Construct validity: whether you’re actually measuring what you want to be
measuring.
- Face validity: whether or not a measure “looks like” it’s doing what it’s supposed to.
How you are going to communicate it to the outside world if to outsiders it does not
feel like its measures what it should measure.
- Ecological validity: the entire set up of the study should closely approximate the real-
world scenario that is being investigated.
Lecture 2
Basic operators in R are:
Logic statements:
Some functions:
, Vectors:
- Create vectors using c()
- Extract specific elements using []
Remove a variable: NULL is a special value in R that means “this variable does not exist” or
“it has no value”. It is different to NA, which means “the variable exists and in principle has a
value, but that value is missing or unknown”.
Extract a row from a data frame:
Extract multiple rows:
Extract multiple rows and columns:
Extract rows that meet a logical condition:
Or:
R needs to know if a variable is a nominal scale:
- A factor is a nominal scale variable
- Use the as.factor() command to convert a character vector to a factor
- This is important when running statistical tests
Use factor() to create a factor
Lists are bundles of variables but they aren’t organized into case by variable structures. In
fact, there’s no analog of cases at all. Lists are useful for handling complex data sets.
Matrices are organized into rows and columns like data frames
Unlike in data frames all values must be the same type
Matrices are useful for complex computations
Exam: multiple choice 80% of the grade. 20% from 6 assignments, complete or incomplete
no extensions. Complete 5/6 for full score.
Lecture 1
Process of identifying a variable of interest to observation:
- Variable identification: identify the variable of interest.
- Conceptualization: then conceptualize. Define the variable as something. What are
you going to ask people?
- Operationalization: you want to be able to operationalize it in an experiment. To be
able to somehow measure the concept that you came up with.
- Observation: collecting observations by receiving respondent answers to the
questions.
Scales of measurement (typically part of the exam):
We can put variables on different scales of measurement. On which scale we put them
depends on how the values of a typical variable are distributed.
- Categorical: has values that are divided in categories.
• binary variable: only two categories (for example either dead or alive)
• Nominal variable: there are more than two categories (for example whether
someone is an omnivore, vegetarian, or vegan)
• Ordinal variable: the same as a nominal variable but the categories have a
logical order (whether people got a fail, a pass, a merit or a distinction in their
exam).
- Continuous: entities get a distinct score
, • Interval variable: equal intervals on the variable represent equal differences
in property being measured (for example the difference between 6 and 8 is
equivalent to the difference between 13 and 15).
• Ratio variable: the same as an interval variable, but the ratios of scores on
the scale must also make sense and have true 0 value (for example a score of
16 on an anxiety scale means that the person is, in reality, twice as anxious as
someone scoring 8). Here the difference between the score of 2 and 4 is still
equivalent to the difference between 8 and 10. However, there is a true 0
value, where 0 means no anxiety. The ratios also make sense.
For example, the difference between 18 and 16 is the same as the difference between 18
and 20 for temperature. However, temperature does not have a true 0 value. 0 does not
mean that there is no temperature. On top of that, 20 degrees is not twice as warm as 10
degrees (because on Fahrenheit scale they are not going to be double of each other).
Therefore, temperature is measured on an interval scale.
Reliability of our measures:
- Reliability: the ability of the measure to produce the same results under the same
condition.
- Test-retest reliability: the ability of a measure to produce consistent results when
the same entities are tested at two different points in time.
- Inter-rater reliability: consistency across people. Do they produce the same answer?
- Parallel form reliability: do different measures that are supposed to measure the
same thing actually measure the same? (Two different eye trackers).
- Internal consistency reliability: do things that are supposed to measure the same
thing actually measure it? (Multiple questions measuring IQ). Do they both measure
IQ to the same extend?
Some variable terminology:
- One that talks about something that has to be explained, depended variable,
outcome.
- The variable that does the explaining, independent variable, predictor.
Common types of research:
- Correlational research: observing what naturally goes on in the world without
directly interfering with it. So, looking at what is going on in the world and drawing
conclusions, but not actually run an experiment or interfere in a direct manner.
- Cross-sectional research: data come from people at different age points with
different people representing each age point. Could be quasi-experimental, case
study, naturalistic observation.
, - Experimental research: one or more variable systematically manipulated to see their
effect (alone or in combination) on an outcome variable. Randomization (random
assignment, random sampling, etc.) statements can often be made about cause and
effect. This is the most important research in the field of data science.
Problems in experimental research:
- Confounds: an unmeasured variable that could be related to the variable of interest.
For example, if you measured the difference in IQ between women and men in the
1920’s. You would conclude that man have a higher IQ. However, this does not come
from the gender, but from the education.
- Artefacts: something that might threaten the external validity or construct validity of
your results (e.g. movement noise in an EEG signal). You see very big jumps in EG
signals. They are not brain activity. This is what happens when you blink. This might
influence what you are trying to measure.
Types of validity:
- Internal validity: the extent to which you are able to draw the correct conclusions
about the casual relationships between variables. So, did you set up your experiment
in such a way that you can draw conclusions about the influence of the dependent
variable on the independent variable.
- External validity: the generalizability of your findings. To what extend do you expect
to see the same pattern of results in “real life” as you saw in your study.
- Construct validity: whether you’re actually measuring what you want to be
measuring.
- Face validity: whether or not a measure “looks like” it’s doing what it’s supposed to.
How you are going to communicate it to the outside world if to outsiders it does not
feel like its measures what it should measure.
- Ecological validity: the entire set up of the study should closely approximate the real-
world scenario that is being investigated.
Lecture 2
Basic operators in R are:
Logic statements:
Some functions:
, Vectors:
- Create vectors using c()
- Extract specific elements using []
Remove a variable: NULL is a special value in R that means “this variable does not exist” or
“it has no value”. It is different to NA, which means “the variable exists and in principle has a
value, but that value is missing or unknown”.
Extract a row from a data frame:
Extract multiple rows:
Extract multiple rows and columns:
Extract rows that meet a logical condition:
Or:
R needs to know if a variable is a nominal scale:
- A factor is a nominal scale variable
- Use the as.factor() command to convert a character vector to a factor
- This is important when running statistical tests
Use factor() to create a factor
Lists are bundles of variables but they aren’t organized into case by variable structures. In
fact, there’s no analog of cases at all. Lists are useful for handling complex data sets.
Matrices are organized into rows and columns like data frames
Unlike in data frames all values must be the same type
Matrices are useful for complex computations