EBC2103 – Economic Psychology
Session 2 – Expected Utility Theory + Rationality ...................................................... 2
Session 3 – Decision-making/tree + Sunk costs + Lens Model ................................ 11
Session 4 – Anchoring + Heuristics + Ratio Rule ..................................................... 18
Session 5 – Conjunction + Story Construction ......................................................... 25
Session 6 – Bayes Theorem..................................................................................... 30
Session 7 – “Good things satiate …” + Trade-offs .................................................... 36
Session 8 – Prospect Theory.................................................................................... 43
Session 9 – Neuroeconomics + Iowa Gambling Task .............................................. 58
Session 10 – Debiasing through law ........................................................................ 65
Session 11 – Moral values........................................................................................ 72
Session 12 – Repugnance + Organ Donation .......................................................... 82
Session 13 – (Hyperbolic) Time Discounting + Self/Other deployed interventions ... 89
1
,Session 2 – Expected Utility Theory + Rationality
Video Lecture 1 – Expected Utility Theory
- Utility Function:
Numerical representation of how a consumer feels about a consumption
bundle or about wealth
- Probabilities are used to measure and to quantify the degree of risk
o Can be estimated, for example, on the basis of historical data
- Expected Utility:
o x and y are the possible outcomes
o U (value) is the utility associated with each outcome
o pr (x/y) are the probabilities of these outcomes
Different decision-makers have different attitudes towards risks:
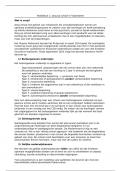
- Risk Aversion → Individuals like to avoid risk
o Figure 17.2 in Perloff 2012
o Utility of a certain payment (40) is higher than a risky payment with the
expected value of 40
o Utility level associated with keeping 40$ is point D (U=120)
o When the vase is worth 70$, point C is associated (U=140)
o But when it’s an imitation, it is worth 10$, which is associated with point
A (U=70)
o Assumption → The probability of the vase being real or not is 50/50 →
0.5 * 70 + 0.5 *140 = EU 105 = point B on the line which links A and C
o Concave means that the person is risk averse → Utility of having a
certain payment of 40$ is higher than the utility associated with an
uncertain decisions that has the expected value of 40$
▪ The utility from a certain payment (D) is higher than the expected
utility of the uncertain payment (B)
o Diminishing marginal utility of wealth:
The extra pleasure from an extra dollar of wealth is smaller than the
extra pleasure associated with the previous
2
, - Risk neutral →
o Constant marginal utility of wealth: Each extra dollar of wealth raises
the utility by the same amount as the previous dollar → Displayed by
the linear association
o Irma would be indifferent between buying the vase or not
▪ The utility associated with a certain payment of 40 is exactly the
same as expected utility of buying the vase → Point B
- Risk-seeking → Individuals are risk preferring
o Increasing utility of wealth: Extra dollar a person gets is worth more
than the previous dollar
o The EU from buying the vase (B) would be higher than the certain utility
when she does not buy the vase (D)
▪ B is higher than D → Should buy the vase
YouTube Video – Indifference Curves
https://www.youtube.com/watch?v=iOmDo5jLFw8
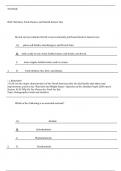
Because we see pizza and coffee as good
things (things that bring us utility) we always
want more or them.
- Obviously 3 pizzas and 3 cups of coffee
are preferred to just 2 pizzas and 2
coffees
- Green region → Any combination in this
region is preferred to the original
combination. Any point here represents
a combination of pizza and coffee, such
that you get more of at least one of
them, or both → Having more is better
- Red region → Any combination in this
region means that you’ll be getting less
of at least one of the goods → Leave
you worse off
3
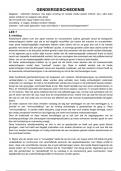
, Combinations of goods that will leave you indifferent →
- Any time someone asks you if you would rather have one combination of
goods versus another, and you go “I do not care”, you are indifferent
- The line that connects the combinations that leave you indifferent is called
your indifference curve
- Each point on the line represents the same amount of satisfaction, or utility
- The indifference curve is not a straight line → It’s slope changes as you move
between different combinations of goods:
o Marginal rate of substitution = The slope of the indifference curve
▪ Measures the rate at which you are willing to forego cups of
coffee in order to get one more pizza, while keeping your utility
constant
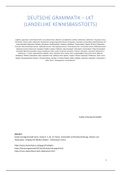
- For example:
o You are considering a certain
combination: 9 coffee and 1 pizza
▪ The marginal rate of
substitution is 4 → This means
you are willing to forego 4
cups of coffee to consume one
more pizza
o As you move along the indifference
curve and start consuming more
pizza, your marginal rate of
substitution falls
▪ Marginal utility: Each
additional pizza you consume provides you with less utility than
the previous one
▪ Maintaining your level of utility implies giving up one cup of
coffee after another
▪ As you are left with fewer and fewer cups of coffee, their
marginal utility increases and the harder it is for you to give them
4
Session 2 – Expected Utility Theory + Rationality ...................................................... 2
Session 3 – Decision-making/tree + Sunk costs + Lens Model ................................ 11
Session 4 – Anchoring + Heuristics + Ratio Rule ..................................................... 18
Session 5 – Conjunction + Story Construction ......................................................... 25
Session 6 – Bayes Theorem..................................................................................... 30
Session 7 – “Good things satiate …” + Trade-offs .................................................... 36
Session 8 – Prospect Theory.................................................................................... 43
Session 9 – Neuroeconomics + Iowa Gambling Task .............................................. 58
Session 10 – Debiasing through law ........................................................................ 65
Session 11 – Moral values........................................................................................ 72
Session 12 – Repugnance + Organ Donation .......................................................... 82
Session 13 – (Hyperbolic) Time Discounting + Self/Other deployed interventions ... 89
1
,Session 2 – Expected Utility Theory + Rationality
Video Lecture 1 – Expected Utility Theory
- Utility Function:
Numerical representation of how a consumer feels about a consumption
bundle or about wealth
- Probabilities are used to measure and to quantify the degree of risk
o Can be estimated, for example, on the basis of historical data
- Expected Utility:
o x and y are the possible outcomes
o U (value) is the utility associated with each outcome
o pr (x/y) are the probabilities of these outcomes
Different decision-makers have different attitudes towards risks:
- Risk Aversion → Individuals like to avoid risk
o Figure 17.2 in Perloff 2012
o Utility of a certain payment (40) is higher than a risky payment with the
expected value of 40
o Utility level associated with keeping 40$ is point D (U=120)
o When the vase is worth 70$, point C is associated (U=140)
o But when it’s an imitation, it is worth 10$, which is associated with point
A (U=70)
o Assumption → The probability of the vase being real or not is 50/50 →
0.5 * 70 + 0.5 *140 = EU 105 = point B on the line which links A and C
o Concave means that the person is risk averse → Utility of having a
certain payment of 40$ is higher than the utility associated with an
uncertain decisions that has the expected value of 40$
▪ The utility from a certain payment (D) is higher than the expected
utility of the uncertain payment (B)
o Diminishing marginal utility of wealth:
The extra pleasure from an extra dollar of wealth is smaller than the
extra pleasure associated with the previous
2
, - Risk neutral →
o Constant marginal utility of wealth: Each extra dollar of wealth raises
the utility by the same amount as the previous dollar → Displayed by
the linear association
o Irma would be indifferent between buying the vase or not
▪ The utility associated with a certain payment of 40 is exactly the
same as expected utility of buying the vase → Point B
- Risk-seeking → Individuals are risk preferring
o Increasing utility of wealth: Extra dollar a person gets is worth more
than the previous dollar
o The EU from buying the vase (B) would be higher than the certain utility
when she does not buy the vase (D)
▪ B is higher than D → Should buy the vase
YouTube Video – Indifference Curves
https://www.youtube.com/watch?v=iOmDo5jLFw8
Because we see pizza and coffee as good
things (things that bring us utility) we always
want more or them.
- Obviously 3 pizzas and 3 cups of coffee
are preferred to just 2 pizzas and 2
coffees
- Green region → Any combination in this
region is preferred to the original
combination. Any point here represents
a combination of pizza and coffee, such
that you get more of at least one of
them, or both → Having more is better
- Red region → Any combination in this
region means that you’ll be getting less
of at least one of the goods → Leave
you worse off
3
, Combinations of goods that will leave you indifferent →
- Any time someone asks you if you would rather have one combination of
goods versus another, and you go “I do not care”, you are indifferent
- The line that connects the combinations that leave you indifferent is called
your indifference curve
- Each point on the line represents the same amount of satisfaction, or utility
- The indifference curve is not a straight line → It’s slope changes as you move
between different combinations of goods:
o Marginal rate of substitution = The slope of the indifference curve
▪ Measures the rate at which you are willing to forego cups of
coffee in order to get one more pizza, while keeping your utility
constant
- For example:
o You are considering a certain
combination: 9 coffee and 1 pizza
▪ The marginal rate of
substitution is 4 → This means
you are willing to forego 4
cups of coffee to consume one
more pizza
o As you move along the indifference
curve and start consuming more
pizza, your marginal rate of
substitution falls
▪ Marginal utility: Each
additional pizza you consume provides you with less utility than
the previous one
▪ Maintaining your level of utility implies giving up one cup of
coffee after another
▪ As you are left with fewer and fewer cups of coffee, their
marginal utility increases and the harder it is for you to give them
4