Tilburg University
Study Program: Pre-Master Data Science and Society
Academic Year 2021/2022, Semester 1 (August to December 2021)
Course: Statistics for Premasters DSS, 800878-B-6
Lecturers: P.H.G. Hendrix and E. Fukuda
,Packages for R assignment & Tutorial Set-Up
• Necessary packages for doing R assignments: knitr, rmarkdown, learnr
• set up for tutorials
o load the libraries
o import the rmd file and run the document
Module 1: Introduction and Research Methods (Chapter 1 & 2)
Why do we learn statistics?
• Develop your critical and analytical thinking skills
• Become an informed consumer (media, politics, etc)
• Save money (don’t need to hire statistician)
• Effectively conduct research in terms of:
o research design
o data collection
o data analysis
• belief bias effect: people’s opinion can be influenced, making neutral conclusions is hard
“believe what we want to believe”
→ statistics = believe in data
• Simpson’s paradox: a trend appears in several groups of data but disappears or reverses
when the groups are combined
Research Design
Generating and testing theories
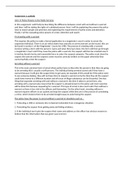
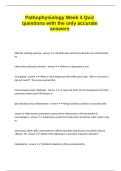
• Research Process
▪Theory: a hypothesized
general principle or set of
principles that explains known
findings about a topic and
from which new hypotheses
can be generated
▪Hypothesis: a prediction
typically derived from a theory
or observation
▪Falsification: the act of
disproving a theory or
hypothesis
,Measurement
• measurement: assigning numbers, labels etc to the thing to be measured
o dependent on environment: different sets of measurements can be appropriate
• theoretical construct: thing, that you are trying to take the measurement of (age, gender …)
• measure: method or tool used to make observations (e.g., survey, brain scan…)
• operationalization: process to derive a measure from a theoretical construct (logical
connection between the measure and the theoretical construct)
• variable: actual data that results after applying our measure
• Scales of Measurement: concept to distinguish between different types of variables
o binary scale variable: only two categories (yes / no)
o nominal scale variable: more than two categories, no relationship between different
possibilities (e.g., gender, eye color)
o ordinal scale variable: same as nominal but ordering the outcomes is useful,
grouping possible but no average (e.g., finishing position in a race)
o interval scale variable: numerical value is meaningful, differences between the
numbers can be interpreted (addition and subtraction are meaningful, but
multiplication is not), no natural “zero number” (e.g., temperature: 0°C is still valid)
o ratio scale variable: zero means zero, multiplication and division are meaningful (e.g.,
response time in a speed test)
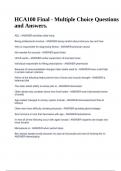
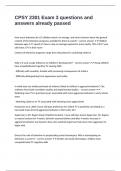
• Continuous vs discrete variables Continuous Categorial/
o continuous: Discrete
a value in the middle of two
Nominal X
others is always possible
Ordinal X
o discrete:
Interval X X
sometimes there is nothing in the middle
Ratio X X
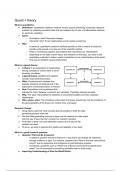
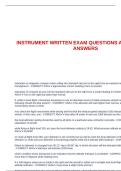
o Likert Scale (e.g., 5-point Likert Scale) as quasi-interval scale because it is hard to
classify it
1 2 3 4 5
Strongly Strongly
disagree agree
Reliability of a measurement
• reliability of a measure tells you how precisely you have measured something
→ it is not about the correctness of the measure, but about its consistency
→ The ability of the measure to produce the same results under the same condition
• Different ways of measuring reliability
→ not all measurements need to possess all forms of reliability!
o test-retest-reliability: Same results when repeat measurement at different time?
o inter-rater-reliability: Consistency across people. Do they produce the same answer?
o parallel forms reliability: same results when using different but theoretically
equivalent measurements?
o internal consistency reliability: Do individual parts with similar functions have similar
results?
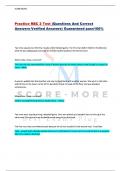
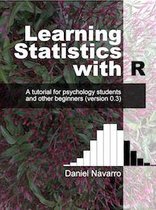
,Predictors and Outcome
Role of the Variable Classical Name Modern Name
y axis: “to be explained” Dependent variable (DV) Outcome
x axis: “to to the explanation” Independent variable (IV) predictor
Experimental vs Non-Experimental Research
• Experimental Research: full control over all aspects of the study
o manipulate or vary the predictor to see how outcomes change while everything else
is kept stable
→ randomization helps to exclude other factors
→ Statements can often be made about cause and effect
• Non-Experimental Research: Any study in which the researcher has less control
• Quasi Experimental Research: Experiment without control over predictor
• Case Studies: Very detailed description of one or a few instances
• Correlational Research: Observing what naturally goes on in the world without directly
interfering with it.
• Cross-sectional Research: This term implies that data come from people at different age
points, with different people representing each age point.
Validity of a measurement
• validity of a measure tells you how accurate the measure is
→ it’s about the correctness of the answer regarding the measure
→ Can you trust the results of your study?
• Types of validity
! Internal validity Ability to draw the correct conclusions about causal
relationship between variables
! External validity Will the results happen in “real life”?
→ Degree of generalizability
Construct validity Do you measure what you want to measure?
Face validity If a measure “looks like” it’s doing what it’s supposed to
→ often not important because does not affect the content
Ecological validity The set-up (design) of the study should closely approximate
the real-world scenario
→ close to external validity but less important
, Confounds, artifacts and other threats to validity
• confound: additional, often unmeasured variable that turns out to the variable of interest
o lack of internal validity
o often within non-experimental studies
• artifacts: something that might threaten the external validity or construct validity of your
results
o often within experimental studies
• threats to validity
o history effects: specific events occur during study
o maturation effects: people change over time
o repeated testing effects: belongs to history effect, first study affects second one
o selection bias: groups differ in relevant characteristics
o differential attrition: people get tired about the study and drop out
o non-response bias: missing data due to no response of people
o regression to the mean: extreme values will become moderate
o experimenter bias: experimenter influences results
o reactivity / demand effects: people alter their performance when being watched
o placebo effect: the mere fact of being treated changes the outcome
o situation, measurement, subpopulation effects: all other treats to external validity
o fraud, deception, self-deception: not all scientists are honest
Study Program: Pre-Master Data Science and Society
Academic Year 2021/2022, Semester 1 (August to December 2021)
Course: Statistics for Premasters DSS, 800878-B-6
Lecturers: P.H.G. Hendrix and E. Fukuda
,Packages for R assignment & Tutorial Set-Up
• Necessary packages for doing R assignments: knitr, rmarkdown, learnr
• set up for tutorials
o load the libraries
o import the rmd file and run the document
Module 1: Introduction and Research Methods (Chapter 1 & 2)
Why do we learn statistics?
• Develop your critical and analytical thinking skills
• Become an informed consumer (media, politics, etc)
• Save money (don’t need to hire statistician)
• Effectively conduct research in terms of:
o research design
o data collection
o data analysis
• belief bias effect: people’s opinion can be influenced, making neutral conclusions is hard
“believe what we want to believe”
→ statistics = believe in data
• Simpson’s paradox: a trend appears in several groups of data but disappears or reverses
when the groups are combined
Research Design
Generating and testing theories
• Research Process
▪Theory: a hypothesized
general principle or set of
principles that explains known
findings about a topic and
from which new hypotheses
can be generated
▪Hypothesis: a prediction
typically derived from a theory
or observation
▪Falsification: the act of
disproving a theory or
hypothesis
,Measurement
• measurement: assigning numbers, labels etc to the thing to be measured
o dependent on environment: different sets of measurements can be appropriate
• theoretical construct: thing, that you are trying to take the measurement of (age, gender …)
• measure: method or tool used to make observations (e.g., survey, brain scan…)
• operationalization: process to derive a measure from a theoretical construct (logical
connection between the measure and the theoretical construct)
• variable: actual data that results after applying our measure
• Scales of Measurement: concept to distinguish between different types of variables
o binary scale variable: only two categories (yes / no)
o nominal scale variable: more than two categories, no relationship between different
possibilities (e.g., gender, eye color)
o ordinal scale variable: same as nominal but ordering the outcomes is useful,
grouping possible but no average (e.g., finishing position in a race)
o interval scale variable: numerical value is meaningful, differences between the
numbers can be interpreted (addition and subtraction are meaningful, but
multiplication is not), no natural “zero number” (e.g., temperature: 0°C is still valid)
o ratio scale variable: zero means zero, multiplication and division are meaningful (e.g.,
response time in a speed test)
• Continuous vs discrete variables Continuous Categorial/
o continuous: Discrete
a value in the middle of two
Nominal X
others is always possible
Ordinal X
o discrete:
Interval X X
sometimes there is nothing in the middle
Ratio X X
o Likert Scale (e.g., 5-point Likert Scale) as quasi-interval scale because it is hard to
classify it
1 2 3 4 5
Strongly Strongly
disagree agree
Reliability of a measurement
• reliability of a measure tells you how precisely you have measured something
→ it is not about the correctness of the measure, but about its consistency
→ The ability of the measure to produce the same results under the same condition
• Different ways of measuring reliability
→ not all measurements need to possess all forms of reliability!
o test-retest-reliability: Same results when repeat measurement at different time?
o inter-rater-reliability: Consistency across people. Do they produce the same answer?
o parallel forms reliability: same results when using different but theoretically
equivalent measurements?
o internal consistency reliability: Do individual parts with similar functions have similar
results?
,Predictors and Outcome
Role of the Variable Classical Name Modern Name
y axis: “to be explained” Dependent variable (DV) Outcome
x axis: “to to the explanation” Independent variable (IV) predictor
Experimental vs Non-Experimental Research
• Experimental Research: full control over all aspects of the study
o manipulate or vary the predictor to see how outcomes change while everything else
is kept stable
→ randomization helps to exclude other factors
→ Statements can often be made about cause and effect
• Non-Experimental Research: Any study in which the researcher has less control
• Quasi Experimental Research: Experiment without control over predictor
• Case Studies: Very detailed description of one or a few instances
• Correlational Research: Observing what naturally goes on in the world without directly
interfering with it.
• Cross-sectional Research: This term implies that data come from people at different age
points, with different people representing each age point.
Validity of a measurement
• validity of a measure tells you how accurate the measure is
→ it’s about the correctness of the answer regarding the measure
→ Can you trust the results of your study?
• Types of validity
! Internal validity Ability to draw the correct conclusions about causal
relationship between variables
! External validity Will the results happen in “real life”?
→ Degree of generalizability
Construct validity Do you measure what you want to measure?
Face validity If a measure “looks like” it’s doing what it’s supposed to
→ often not important because does not affect the content
Ecological validity The set-up (design) of the study should closely approximate
the real-world scenario
→ close to external validity but less important
, Confounds, artifacts and other threats to validity
• confound: additional, often unmeasured variable that turns out to the variable of interest
o lack of internal validity
o often within non-experimental studies
• artifacts: something that might threaten the external validity or construct validity of your
results
o often within experimental studies
• threats to validity
o history effects: specific events occur during study
o maturation effects: people change over time
o repeated testing effects: belongs to history effect, first study affects second one
o selection bias: groups differ in relevant characteristics
o differential attrition: people get tired about the study and drop out
o non-response bias: missing data due to no response of people
o regression to the mean: extreme values will become moderate
o experimenter bias: experimenter influences results
o reactivity / demand effects: people alter their performance when being watched
o placebo effect: the mere fact of being treated changes the outcome
o situation, measurement, subpopulation effects: all other treats to external validity
o fraud, deception, self-deception: not all scientists are honest