Summary Syllabus BBS1003
Chapter 1
1.1 Types of variables
Two variables:
- Qualitative variables (categorical/discrete): nominal, ordinal
- Quantitative variables (continuous): interval, ratio
Nominal: the score are only intended to distinguish between the different
categories. Like 0=female and 1=male. The scores don’t have any
meaning.
vb. Hair colour
- No order
- The space between the scores does not have any meaning
Ordinal: the categories are ordered.
vb. Social economic class (low, middle, high)
Interval: the distance between the scores have a meaning
vb. Temp in °C, IQ level
Ratio: there is an absolute zero point.
vb. Weight, age
1.2 Summarizing data
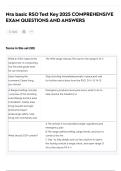
You can put the data in a frequency table.
Another way to summarize the data is to make a bar chart.
Pagina 1 van 26
,Summary Syllabus BBS1003
A bar chart has a blank space between the bars.
The bars are not connected to each other and the distance between the
bars does not have any meaning either.
A bar chart is often used to summarize the outcome of a qualitative
variable.
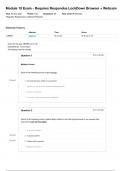
In a histogram there is no space between the bars and we use it to
summarize quantitative variables.
Each bar has a surface that is exactly equal to the frequency of the score
represented by that bar.
To create a histogram, we use grouping.
11.3 5.1 12.1 7.8 15.9 8.2 10.7 6.8 10.7 12.9
11.7 12.6 8.1 9.4 12.9 8.2 3.8 11.4 10.3 6.1
n = 20
smallest score = 3.8
largest score = 15.9
A possible width is 3, so you create 5 classes.
[3.5, 6.5>, [6.5, 9.5>, … [15.5, 18.5>
Pagina 2 van 26
, Summary Syllabus BBS1003
1.3 Theoretic distribution, measures of tendency and Pearson correlation
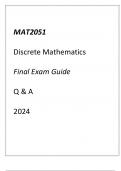
When the number of classes becomes very large, then we will create a
theoretic distribution.
Negative: left skewed
Positive: right skewed
The mean is very sensitive for extreme values. When the distribution
is skewed to the right, it means that there are (extreme) large values.
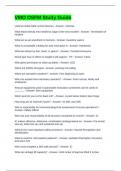
Variance = a measure of how peeked/flat the distribution is. It represents
much the subjects differ from each other regarding to their scores.
The variance and the standard deviation represent the same
information.
But the SD is more used because it is expressed in the same scale as
the values.
vb. if X represents length in inches, then the average value and the SD are
also expressed in inches. The variance is expressed as ‘square of inches’,
which is more difficult to interpret in practice.
Pagina 3 van 26
Chapter 1
1.1 Types of variables
Two variables:
- Qualitative variables (categorical/discrete): nominal, ordinal
- Quantitative variables (continuous): interval, ratio
Nominal: the score are only intended to distinguish between the different
categories. Like 0=female and 1=male. The scores don’t have any
meaning.
vb. Hair colour
- No order
- The space between the scores does not have any meaning
Ordinal: the categories are ordered.
vb. Social economic class (low, middle, high)
Interval: the distance between the scores have a meaning
vb. Temp in °C, IQ level
Ratio: there is an absolute zero point.
vb. Weight, age
1.2 Summarizing data
You can put the data in a frequency table.
Another way to summarize the data is to make a bar chart.
Pagina 1 van 26
,Summary Syllabus BBS1003
A bar chart has a blank space between the bars.
The bars are not connected to each other and the distance between the
bars does not have any meaning either.
A bar chart is often used to summarize the outcome of a qualitative
variable.
In a histogram there is no space between the bars and we use it to
summarize quantitative variables.
Each bar has a surface that is exactly equal to the frequency of the score
represented by that bar.
To create a histogram, we use grouping.
11.3 5.1 12.1 7.8 15.9 8.2 10.7 6.8 10.7 12.9
11.7 12.6 8.1 9.4 12.9 8.2 3.8 11.4 10.3 6.1
n = 20
smallest score = 3.8
largest score = 15.9
A possible width is 3, so you create 5 classes.
[3.5, 6.5>, [6.5, 9.5>, … [15.5, 18.5>
Pagina 2 van 26
, Summary Syllabus BBS1003
1.3 Theoretic distribution, measures of tendency and Pearson correlation
When the number of classes becomes very large, then we will create a
theoretic distribution.
Negative: left skewed
Positive: right skewed
The mean is very sensitive for extreme values. When the distribution
is skewed to the right, it means that there are (extreme) large values.
Variance = a measure of how peeked/flat the distribution is. It represents
much the subjects differ from each other regarding to their scores.
The variance and the standard deviation represent the same
information.
But the SD is more used because it is expressed in the same scale as
the values.
vb. if X represents length in inches, then the average value and the SD are
also expressed in inches. The variance is expressed as ‘square of inches’,
which is more difficult to interpret in practice.
Pagina 3 van 26