2.1 Variables and data
Data terminology
observation = a single member of a collection of items that we want to study (e.g. a firm)
variable = a characteristic of the subject or individual (e.g. employee’s income)
data set = consists of all the values of all of the variables for all the observations we have
chosen to observe
Specifically each column is a variable and each row is an observation
Time series data: if each observation in the sample represents a different equally spaced
point in time (years, months, days)
Periodicity is the time between observations
Cross-sectional data: If each observation represents a different unit (e.g. a person, firm etc.)
at the same point in time
For this type of data we are interested in variation among observations or in relationships.
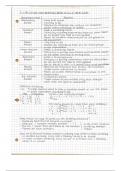
2.2 Level of measurement
,3.1 Stem-and-leaf displays and dotplots
Stem-and-leaf display
- simple way to visualize small data sets with integers
- tool of exploratory data analysis
Dot Plots
- another simple graphical display of n individual values of numerical data
- it shows variability by displaying the range of data, it shows center by revealing
where the data values tend to cluster and where the midpoint lies.
- can also reveal things about the shape of the distribution if sample is large enough
- a stacked dot plot can be used to compare two or more groups
3.2 Frequency distributions and histograms
Frequency distribution
- a table formed by classifying n data values into k classes called bins. The bin limits
define the values to be included in each bin.
- the table shows the frequency of data values within each bin
- frequencies can be expressed as relative frequencies or in % of the total number of
observations
Histograms
- a graphical representation of a frequency distribution
- column chart whose Y-axis shows the number of data values (or %) within each bin
of a frequency distribution and whose X-axis show the end points of each bin
- shape: suggests the shape of the population we are sampling.
- skewness: indicated by the direction of its longer tail. If neither tail is
longer → symmetric, longer right tail (most business data) → right-skewed
(positive skewed), longer left tail → left-skewed (negatively skewed)
, - outlier: extreme value that is far enough from the majority of the data that it probably
arose from a different cause or is due to measurement error
3.4 Line charts
- used to display a time series, to spot trends, or to compare time periods.
3.5 Column and bar charts
- a column chart is a vertical display of data and a bar chart is a horizontal display of
data
3.6 Pie charts
- because of their visual appeal, pie charts appear daily in company annual reports
3.7 Scatter plots
- shows n pairs of observations (X1, Y2), (X2,Y2), …. (Xn, Yn) as dots (or some other
symbol)
- starting point for bivariate data analysis
- to investigate the relationship between two variables. Typically we would like to know
if there is an association between two variables and if so, what kind of association
- typical scatter plot patterns: strong positive, strong negative, weak positive, weak
negative, no pattern, nonlinear pattern
3.8 Tables
- most simple form of data display
- rows and columns
Chapter 4: Descriptive statistics
4.1 Numerical description of data
- Descriptive measures derived from a sample (n items) are statistics, while for a
population (N items or infinite) are parameters
4.2 Measures of center
, 4.3 Measures of variability
- variation: to describe variation around the center
4.4 Standardized Data
Data terminology
observation = a single member of a collection of items that we want to study (e.g. a firm)
variable = a characteristic of the subject or individual (e.g. employee’s income)
data set = consists of all the values of all of the variables for all the observations we have
chosen to observe
Specifically each column is a variable and each row is an observation
Time series data: if each observation in the sample represents a different equally spaced
point in time (years, months, days)
Periodicity is the time between observations
Cross-sectional data: If each observation represents a different unit (e.g. a person, firm etc.)
at the same point in time
For this type of data we are interested in variation among observations or in relationships.
2.2 Level of measurement
,3.1 Stem-and-leaf displays and dotplots
Stem-and-leaf display
- simple way to visualize small data sets with integers
- tool of exploratory data analysis
Dot Plots
- another simple graphical display of n individual values of numerical data
- it shows variability by displaying the range of data, it shows center by revealing
where the data values tend to cluster and where the midpoint lies.
- can also reveal things about the shape of the distribution if sample is large enough
- a stacked dot plot can be used to compare two or more groups
3.2 Frequency distributions and histograms
Frequency distribution
- a table formed by classifying n data values into k classes called bins. The bin limits
define the values to be included in each bin.
- the table shows the frequency of data values within each bin
- frequencies can be expressed as relative frequencies or in % of the total number of
observations
Histograms
- a graphical representation of a frequency distribution
- column chart whose Y-axis shows the number of data values (or %) within each bin
of a frequency distribution and whose X-axis show the end points of each bin
- shape: suggests the shape of the population we are sampling.
- skewness: indicated by the direction of its longer tail. If neither tail is
longer → symmetric, longer right tail (most business data) → right-skewed
(positive skewed), longer left tail → left-skewed (negatively skewed)
, - outlier: extreme value that is far enough from the majority of the data that it probably
arose from a different cause or is due to measurement error
3.4 Line charts
- used to display a time series, to spot trends, or to compare time periods.
3.5 Column and bar charts
- a column chart is a vertical display of data and a bar chart is a horizontal display of
data
3.6 Pie charts
- because of their visual appeal, pie charts appear daily in company annual reports
3.7 Scatter plots
- shows n pairs of observations (X1, Y2), (X2,Y2), …. (Xn, Yn) as dots (or some other
symbol)
- starting point for bivariate data analysis
- to investigate the relationship between two variables. Typically we would like to know
if there is an association between two variables and if so, what kind of association
- typical scatter plot patterns: strong positive, strong negative, weak positive, weak
negative, no pattern, nonlinear pattern
3.8 Tables
- most simple form of data display
- rows and columns
Chapter 4: Descriptive statistics
4.1 Numerical description of data
- Descriptive measures derived from a sample (n items) are statistics, while for a
population (N items or infinite) are parameters
4.2 Measures of center
, 4.3 Measures of variability
- variation: to describe variation around the center
4.4 Standardized Data