Business A-level Paper 2
2.2 Financial planning
2.2.3 Break-even
Break-even - A position where a business is selling just enough to cover its costs
without making a profit
¿ costs
Break even point=
(selling price−variable cost per unit)
Contribution - Selling price – cost per unit = contribution per unit
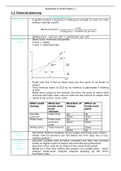
Break-even - Show costs, revenues and profits
charts - X axis = output
- Y axis = costs/revenues
- Fixed cost line is flat as fixed costs are the same at all levels of
output
- Total revenue starts at (0,0) as no revenue is generated if nothing
is sold
- Break-even output is the vertical line from the point at which total
revenue and total costs cross to read out the amount of output that
needs to be sold to cover costs
What could What line Direction of Effect on
change would need change break-even
to be point
redrawn
Variable Total costs Up Up
cost/unit Down Down
Fixed costs Fixed costs Up Up
and total Down Down
costs
Selling price Total revenue Up Down
Down Up
Margin of - Horizontal distance between actual output and break-even output
safety - Shows how far demand can fall before the firm slips into a loss-
making position
Limitations - Assumes variable costs increase constantly but they may increase
of break- slowly at higher levels of output due to bulk-buying discounts
even - Assumes a firm sells all its output in the same time period
analysis - Based on a firm only selling one product at a single price – multi-
product break-even analysis requires splitting up the firm’s
overhead costs
, Business A-level Paper 2
- Break-even charts are statistical models, showing only the possible
situation at one moment in time, ineffective at showing the effect
of changing external variables
2.2.4 Budgets
Budgets - A financial plan for the future concerning revenues and costs of a
business
- Budgeting is the process by which financial control is exercised in a
business
- Budgets for revenues and costs are prepared in advance and then
compared with actual performance to establish variances
- Managers take remedial action if adverse variances are regarded
as excessive
Purpose of - Provides a quantifiable target – can be communicated to interested
budgets parties against which actual outcomes can be measured
- Helps with planning and forecasting
- Focus expenditure on the company’s main objectives
- No individual or department spends more than the company
expects
- Provides a yardstick against which performance can be measured
- Enables spending power to be delegated to local managers, who
are in a better position to know how to best use the money
- Should improve and speed up decision making
- Helps motivate local budget holders
Historical - Uses last year’s budget as a guide and then adjusting based on
budget known changes in circumstances for the department
- Realistic in that it is based on actual results
- Circumstances may have changed
- Does not encourage efficiency
Zero-based - Sets each department’s budget at zero and demands that budget
budget holders justify every pound they ask for
- Sensible to use every few years
- Prevents wastage that occurs if budgets creep upwards yearly
- Time-consuming to find good justifications
Variance - Looking back to calculate the difference between a budgeted figure
analysis and the actual figure that occurred
- Allows managers to spot areas where there is a significant
difference between the budget and the reality
- Provide an early warning
Types of variances
- Adverse – actual figure is worse than the budgeted figure and so
reduces profit
- Favourable – actual figure is better than the budgeted figure and so
revenue goes up and costs go down
Causes of favourable variances
- Stronger market demand than expected, causing a higher actual
revenue
- Selling prices increased to higher than the budget
- Cautious sales and cost assumptions (e.g. cost contingencies)
- Competitor weakness leading to higher sales
- Better than expected productivity or efficiency
2.2 Financial planning
2.2.3 Break-even
Break-even - A position where a business is selling just enough to cover its costs
without making a profit
¿ costs
Break even point=
(selling price−variable cost per unit)
Contribution - Selling price – cost per unit = contribution per unit
Break-even - Show costs, revenues and profits
charts - X axis = output
- Y axis = costs/revenues
- Fixed cost line is flat as fixed costs are the same at all levels of
output
- Total revenue starts at (0,0) as no revenue is generated if nothing
is sold
- Break-even output is the vertical line from the point at which total
revenue and total costs cross to read out the amount of output that
needs to be sold to cover costs
What could What line Direction of Effect on
change would need change break-even
to be point
redrawn
Variable Total costs Up Up
cost/unit Down Down
Fixed costs Fixed costs Up Up
and total Down Down
costs
Selling price Total revenue Up Down
Down Up
Margin of - Horizontal distance between actual output and break-even output
safety - Shows how far demand can fall before the firm slips into a loss-
making position
Limitations - Assumes variable costs increase constantly but they may increase
of break- slowly at higher levels of output due to bulk-buying discounts
even - Assumes a firm sells all its output in the same time period
analysis - Based on a firm only selling one product at a single price – multi-
product break-even analysis requires splitting up the firm’s
overhead costs
, Business A-level Paper 2
- Break-even charts are statistical models, showing only the possible
situation at one moment in time, ineffective at showing the effect
of changing external variables
2.2.4 Budgets
Budgets - A financial plan for the future concerning revenues and costs of a
business
- Budgeting is the process by which financial control is exercised in a
business
- Budgets for revenues and costs are prepared in advance and then
compared with actual performance to establish variances
- Managers take remedial action if adverse variances are regarded
as excessive
Purpose of - Provides a quantifiable target – can be communicated to interested
budgets parties against which actual outcomes can be measured
- Helps with planning and forecasting
- Focus expenditure on the company’s main objectives
- No individual or department spends more than the company
expects
- Provides a yardstick against which performance can be measured
- Enables spending power to be delegated to local managers, who
are in a better position to know how to best use the money
- Should improve and speed up decision making
- Helps motivate local budget holders
Historical - Uses last year’s budget as a guide and then adjusting based on
budget known changes in circumstances for the department
- Realistic in that it is based on actual results
- Circumstances may have changed
- Does not encourage efficiency
Zero-based - Sets each department’s budget at zero and demands that budget
budget holders justify every pound they ask for
- Sensible to use every few years
- Prevents wastage that occurs if budgets creep upwards yearly
- Time-consuming to find good justifications
Variance - Looking back to calculate the difference between a budgeted figure
analysis and the actual figure that occurred
- Allows managers to spot areas where there is a significant
difference between the budget and the reality
- Provide an early warning
Types of variances
- Adverse – actual figure is worse than the budgeted figure and so
reduces profit
- Favourable – actual figure is better than the budgeted figure and so
revenue goes up and costs go down
Causes of favourable variances
- Stronger market demand than expected, causing a higher actual
revenue
- Selling prices increased to higher than the budget
- Cautious sales and cost assumptions (e.g. cost contingencies)
- Competitor weakness leading to higher sales
- Better than expected productivity or efficiency