GTS 261: STUDY UNIT 3: Quantitative
Genetics
24.1 Quantitative Characteristics Are Influenced by Alleles at Multiple
Loci
Qualitative
- Discontinuous trait
- Different categories
o For example, male vs female
o Round vs wrinkled peas (Mendel)
- Genotype = Phenotype straightforward
o For example, XX = female; XY = male
o AA, Aa = round; aa = wrinkled
Quantitative
- Large variation in characteristic
o For example, human height
o Weight
- Genotype = Phenotype not straightforward
o For example, can get the same phenotype from different genotypes
Quantitative characteristics arise from two phenomena:
1. many are polygenic: they are influenced by genes at many loci. If many loci take part, many
genotypes are possible, resulting in many different phenotypes.
2. quantitative characteristics often arise when environmental factors affect the phenotype
because environmental variation results in a single genotype producing a range of
phenotypes.
- Most continuously varying characteristics are both polygenic and influenced by environmental
factors, and these characteristics are said to be multifactorial.
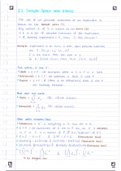
- When the lines on a graph of environment and phenotype cross it indicates interaction.
, - The simple relation between genotype and phenotype that exists for many qualitative
(discontinuous) characteristics is absent for quantitative characteristics, and it is impossible to
assign a genotype to an individual on the basis of its phenotype alone.
Types of Quantitative Characteristics
A continuous characteristic can theoretically assume any value between two extremes.
- Some characteristics are not continuous but are nevertheless considered quantitative because they are determined by
multiple genetic and environmental factors. Meristic characteristics, for instance, are measured in whole numbers. An
example is litter size: a female mouse can have 4, 5, or 6 pups, but not 4.13 pups. A meristic characteristic has a limited
number of distinct phenotypes, but the underlying determination of the characteristic is still quantitative.
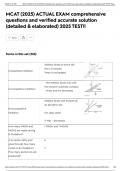
- Another type of quantitative characteristic is a threshold characteristic, which is simply present or absent. Although
threshold characteristics exhibit only two phenotypes, they
are considered quantitative because they, too, are
determined by multiple genetic and environmental factors.
The expression of the characteristic depends on an
underlying susceptibility (usually referred to as liability or
risk) that varies continuously. When the susceptibility is
larger than a threshold value, a specific trait is expressed
e.g. is diseases.
Polygenic Inheritance
,Determining Gene Number for a Polygenic Characteristic
-
-
24.2 Statistical Methods Are Required for Analyzing Quantitative
Characteristics
Distributions
- frequency distribution, is a graph of the frequencies (numbers or proportions) of the different
phenotypes.
- In a typical frequency distribution, phenotypic classes are plotted on the horizontal ( x) axis, and
the numbers (or proportions) of individuals in each class are plotted on the vertical ( y) axis.
- Connecting the points of a frequency distribution with a line creates a curve that is
characteristic of the distribution. Many quantitative characteristics exhibit a symmetrical (bell-
shaped) curve called a normal distribution.
Samples and Populations
- The group of interest, called the population, is too large for a complete census. One solution is to
measure a smaller collection of individuals, called a sample, and use those measurements to
describe the population.
- A good sample must have several characteristics:
1. it must be representative of the whole population
2. the sample must be large enough that chance differences between the individuals in the sample and
the overall population do not distort the estimate of the population measurements.
The Mean
- The mean, also called the average, is a statistic that provides information about the center of a
distribution.
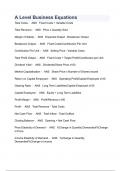
, The Variance and Standard Deviation
- Variance indicates the variability of a group of measurements, or how spread out
the distribution is.
- To calculate the variance, we (1) subtract the mean from each measurement and
square the value obtained, (2) add all of these squared deviations together, and (3)
divide that sum by the number of original measurements minus 1.
- Standard deviation is defined as the square root of the variance.
- Benefits of s vs s2
1. Same units as original measurement
2. Estimate proportion of expected cases
o 66% of cases fall within mean +- 1s
o 95% of cases fall within mean +- 2s
o 99% of cases fall within mean +- 3s
Genetics
24.1 Quantitative Characteristics Are Influenced by Alleles at Multiple
Loci
Qualitative
- Discontinuous trait
- Different categories
o For example, male vs female
o Round vs wrinkled peas (Mendel)
- Genotype = Phenotype straightforward
o For example, XX = female; XY = male
o AA, Aa = round; aa = wrinkled
Quantitative
- Large variation in characteristic
o For example, human height
o Weight
- Genotype = Phenotype not straightforward
o For example, can get the same phenotype from different genotypes
Quantitative characteristics arise from two phenomena:
1. many are polygenic: they are influenced by genes at many loci. If many loci take part, many
genotypes are possible, resulting in many different phenotypes.
2. quantitative characteristics often arise when environmental factors affect the phenotype
because environmental variation results in a single genotype producing a range of
phenotypes.
- Most continuously varying characteristics are both polygenic and influenced by environmental
factors, and these characteristics are said to be multifactorial.
- When the lines on a graph of environment and phenotype cross it indicates interaction.
, - The simple relation between genotype and phenotype that exists for many qualitative
(discontinuous) characteristics is absent for quantitative characteristics, and it is impossible to
assign a genotype to an individual on the basis of its phenotype alone.
Types of Quantitative Characteristics
A continuous characteristic can theoretically assume any value between two extremes.
- Some characteristics are not continuous but are nevertheless considered quantitative because they are determined by
multiple genetic and environmental factors. Meristic characteristics, for instance, are measured in whole numbers. An
example is litter size: a female mouse can have 4, 5, or 6 pups, but not 4.13 pups. A meristic characteristic has a limited
number of distinct phenotypes, but the underlying determination of the characteristic is still quantitative.
- Another type of quantitative characteristic is a threshold characteristic, which is simply present or absent. Although
threshold characteristics exhibit only two phenotypes, they
are considered quantitative because they, too, are
determined by multiple genetic and environmental factors.
The expression of the characteristic depends on an
underlying susceptibility (usually referred to as liability or
risk) that varies continuously. When the susceptibility is
larger than a threshold value, a specific trait is expressed
e.g. is diseases.
Polygenic Inheritance
,Determining Gene Number for a Polygenic Characteristic
-
-
24.2 Statistical Methods Are Required for Analyzing Quantitative
Characteristics
Distributions
- frequency distribution, is a graph of the frequencies (numbers or proportions) of the different
phenotypes.
- In a typical frequency distribution, phenotypic classes are plotted on the horizontal ( x) axis, and
the numbers (or proportions) of individuals in each class are plotted on the vertical ( y) axis.
- Connecting the points of a frequency distribution with a line creates a curve that is
characteristic of the distribution. Many quantitative characteristics exhibit a symmetrical (bell-
shaped) curve called a normal distribution.
Samples and Populations
- The group of interest, called the population, is too large for a complete census. One solution is to
measure a smaller collection of individuals, called a sample, and use those measurements to
describe the population.
- A good sample must have several characteristics:
1. it must be representative of the whole population
2. the sample must be large enough that chance differences between the individuals in the sample and
the overall population do not distort the estimate of the population measurements.
The Mean
- The mean, also called the average, is a statistic that provides information about the center of a
distribution.
, The Variance and Standard Deviation
- Variance indicates the variability of a group of measurements, or how spread out
the distribution is.
- To calculate the variance, we (1) subtract the mean from each measurement and
square the value obtained, (2) add all of these squared deviations together, and (3)
divide that sum by the number of original measurements minus 1.
- Standard deviation is defined as the square root of the variance.
- Benefits of s vs s2
1. Same units as original measurement
2. Estimate proportion of expected cases
o 66% of cases fall within mean +- 1s
o 95% of cases fall within mean +- 2s
o 99% of cases fall within mean +- 3s