Descriptive Statistics
Chapter 2: Tabular and Graphical Displays
Data visualization = describe use of
graphical displays 2 summarize &
present info about data set.
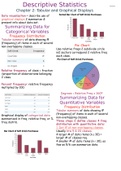
Summarizing Data for
Categorical Variables
Frequency Distribution
Tabular summary of data showing #
(frequency) of items in each of several
non-overlapping classes. Pie Chart
Use relative freqs 2 subdivide circle
in2 sectors correspond 2 relative freq
each class.
Relative frequency of class = fraction
/proportion of observations belonging
2 class.
Percent Frequency: relative frequency
multiplied by 100.
Degrees = Relative Freq x 360º
Summarizing Data for
Quantitative Variables
Frequency Distribution
Bar Charts Tabular summary of data showing #
(frequency) of items in each of several
Graphical display of categorical data
summarized in freq, relative freq, or % non-overlapping classes.
Three steps 2 define classes 4 freq
freq distrib.
distribution with quantitative data:
1. Det # of non-overlapping classes.
Usually btw 5 & 20 classes.
4 larger # of data items (n ≥ 30) =
larger # of classes req.
4 smaller # of data items (n < 30), as
few as 5/6 can summarize data.
Chapter 2: Tabular and Graphical Displays
Data visualization = describe use of
graphical displays 2 summarize &
present info about data set.
Summarizing Data for
Categorical Variables
Frequency Distribution
Tabular summary of data showing #
(frequency) of items in each of several
non-overlapping classes. Pie Chart
Use relative freqs 2 subdivide circle
in2 sectors correspond 2 relative freq
each class.
Relative frequency of class = fraction
/proportion of observations belonging
2 class.
Percent Frequency: relative frequency
multiplied by 100.
Degrees = Relative Freq x 360º
Summarizing Data for
Quantitative Variables
Frequency Distribution
Bar Charts Tabular summary of data showing #
(frequency) of items in each of several
Graphical display of categorical data
summarized in freq, relative freq, or % non-overlapping classes.
Three steps 2 define classes 4 freq
freq distrib.
distribution with quantitative data:
1. Det # of non-overlapping classes.
Usually btw 5 & 20 classes.
4 larger # of data items (n ≥ 30) =
larger # of classes req.
4 smaller # of data items (n < 30), as
few as 5/6 can summarize data.