GIZMOS Student Exploration Hardy-Weinberg
Equilibrium
Name: Steven Maldonado Date: May 2, 2017
Student Exploration: Hardy-Weinberg Equilibrium
Vocabulary: allele, genotype, Hardy-Weinberg equation, Hardy-Weinberg principle,
heterozygous, homozygous, Punnett square
Prior Knowledge Questions (Do these BEFORE using the Gizmo.)
Suppose the feather color of a bird is controlled by two alleles, D and d. The D allele results in
dark feathers, while the d allele results in lighter feathers.
1. Suppose two Dd birds mate. What percentages of DD, Dd, and dd
offspring would you predict? Use the Punnett square at right to
m
help determine your answer.
er as
DD: 25% Dd: 50% dd: 25%
co
eH w
o.
2. In this situation, what ratio of heterozygous (Dd) to homozygous (DD and dd) offspring
rs e
ou urc
would you expect to find? 1:1 ratio of heterozygous (Dd) to homozygous (DD and dd).
o
Gizmo Warm-up
Many factors—immigration, natural selection, hunting, and
aC s
so forth—can influence the composition of a population. To
vi y re
determine if one of these factors is affecting a population, it
is useful to know what a population looks like when none
of these factors is present.
ed d
In 1908, Godfrey Hardy and Wilhelm Weinberg independently discovered the laws that govern
ar stu
such populations. These laws can be explored in the Hardy-Weinberg Equilibrium Gizmo™.
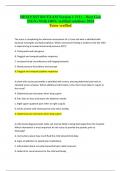
1. The parrots you see on the SIMULATION pane represent a larger population of 500 parrots.
Select the TABLE tab. How many parrots of each genotype are in the initial population?
is
DD: 250 parrots Dd: 100 parrots dd: 150 parrots
Th
2. Return to the DESCRIPTION tab. Click Begin, and then click Breed. What happens?
sh
The birds reproduce, making eggs.
3. Click Hatch, and look on the TABLE tab. What are the parrot populations now?
DD: 178 Dd: 248 dd: 78
This study source was downloaded by 100000828331062 from CourseHero.com on 07-23-2021 11:49:32 GMT -05:00
https://www.coursehero.com/file/30570427/HardyWeinbergSE-2pdf/
, Activity A: Get the Gizmo ready:
Alleles and • On the DESCRIPTION tab, click Reset.
genotypes • Check that DD is 50% and dd is 30%.
Question: How will the proportion of genotypes and alleles change over time when
mating is random and no natural selection is occurring?
1. Predict: How do you expect the proportions of D and d alleles to change over time?
I expect there to be a change from homozygous making the overall population of the
heterozygous parrots increase (Dd).
2. Gather data: Run a generation in the Gizmo. After clicking Hatch, fill in the allele and
genotype percentages for generation 1. Repeat this process for 5 generations.
Initial Generation
m
values
er as
1 2 3 4 5
co
% D alleles 60 59 59.3 57.5 59.1 59.7
eH w
% d alleles 40 41 40.7 42.5 40.9 40.3
o.
% of DD genotype 50 35.6 36.6 33.6 35.2 35.6
rs e
ou urc
% of Dd genotype 20 46.8 45.4 47.8 47.8 48.2
% of dd genotype 30 17.6 18.0 18.6 17.0 16.2
o
aC s
3. Analyze: What patterns do you see in your data? The pattern is a decrease in the
vi y re
percentage of D alleles, an overall increase in the percentage of d alleles, major decrease in
the percentage of the DD genotype, major increase in the percentage of the Dd genotype,
decrease in the percentage of the dd genotype.
ed d
4. Interpret: Select the ALLELE GRAPH tab. What does this graph show? This graph shows
ar stu
the allele percentage throughout each of the generations, showing both the percentage of D
alleles and d alleles expressed in two different colors.
is
5. Interpret: Select the GENOTYPE GRAPH tab. What does this graph show? The genotype
Th
graph shows the genotype percentage, giving all three types of possible genotypes DD
genotypes, Dd genotypes, and dd genotypes.
(Activity A continued on next page)
sh
This study source was downloaded by 100000828331062 from CourseHero.com on 07-23-2021 11:49:32 GMT -05:00
https://www.coursehero.com/file/30570427/HardyWeinbergSE-2pdf/
Equilibrium
Name: Steven Maldonado Date: May 2, 2017
Student Exploration: Hardy-Weinberg Equilibrium
Vocabulary: allele, genotype, Hardy-Weinberg equation, Hardy-Weinberg principle,
heterozygous, homozygous, Punnett square
Prior Knowledge Questions (Do these BEFORE using the Gizmo.)
Suppose the feather color of a bird is controlled by two alleles, D and d. The D allele results in
dark feathers, while the d allele results in lighter feathers.
1. Suppose two Dd birds mate. What percentages of DD, Dd, and dd
offspring would you predict? Use the Punnett square at right to
m
help determine your answer.
er as
DD: 25% Dd: 50% dd: 25%
co
eH w
o.
2. In this situation, what ratio of heterozygous (Dd) to homozygous (DD and dd) offspring
rs e
ou urc
would you expect to find? 1:1 ratio of heterozygous (Dd) to homozygous (DD and dd).
o
Gizmo Warm-up
Many factors—immigration, natural selection, hunting, and
aC s
so forth—can influence the composition of a population. To
vi y re
determine if one of these factors is affecting a population, it
is useful to know what a population looks like when none
of these factors is present.
ed d
In 1908, Godfrey Hardy and Wilhelm Weinberg independently discovered the laws that govern
ar stu
such populations. These laws can be explored in the Hardy-Weinberg Equilibrium Gizmo™.
1. The parrots you see on the SIMULATION pane represent a larger population of 500 parrots.
Select the TABLE tab. How many parrots of each genotype are in the initial population?
is
DD: 250 parrots Dd: 100 parrots dd: 150 parrots
Th
2. Return to the DESCRIPTION tab. Click Begin, and then click Breed. What happens?
sh
The birds reproduce, making eggs.
3. Click Hatch, and look on the TABLE tab. What are the parrot populations now?
DD: 178 Dd: 248 dd: 78
This study source was downloaded by 100000828331062 from CourseHero.com on 07-23-2021 11:49:32 GMT -05:00
https://www.coursehero.com/file/30570427/HardyWeinbergSE-2pdf/
, Activity A: Get the Gizmo ready:
Alleles and • On the DESCRIPTION tab, click Reset.
genotypes • Check that DD is 50% and dd is 30%.
Question: How will the proportion of genotypes and alleles change over time when
mating is random and no natural selection is occurring?
1. Predict: How do you expect the proportions of D and d alleles to change over time?
I expect there to be a change from homozygous making the overall population of the
heterozygous parrots increase (Dd).
2. Gather data: Run a generation in the Gizmo. After clicking Hatch, fill in the allele and
genotype percentages for generation 1. Repeat this process for 5 generations.
Initial Generation
m
values
er as
1 2 3 4 5
co
% D alleles 60 59 59.3 57.5 59.1 59.7
eH w
% d alleles 40 41 40.7 42.5 40.9 40.3
o.
% of DD genotype 50 35.6 36.6 33.6 35.2 35.6
rs e
ou urc
% of Dd genotype 20 46.8 45.4 47.8 47.8 48.2
% of dd genotype 30 17.6 18.0 18.6 17.0 16.2
o
aC s
3. Analyze: What patterns do you see in your data? The pattern is a decrease in the
vi y re
percentage of D alleles, an overall increase in the percentage of d alleles, major decrease in
the percentage of the DD genotype, major increase in the percentage of the Dd genotype,
decrease in the percentage of the dd genotype.
ed d
4. Interpret: Select the ALLELE GRAPH tab. What does this graph show? This graph shows
ar stu
the allele percentage throughout each of the generations, showing both the percentage of D
alleles and d alleles expressed in two different colors.
is
5. Interpret: Select the GENOTYPE GRAPH tab. What does this graph show? The genotype
Th
graph shows the genotype percentage, giving all three types of possible genotypes DD
genotypes, Dd genotypes, and dd genotypes.
(Activity A continued on next page)
sh
This study source was downloaded by 100000828331062 from CourseHero.com on 07-23-2021 11:49:32 GMT -05:00
https://www.coursehero.com/file/30570427/HardyWeinbergSE-2pdf/