Measurement and Diagnostics
Chapter 1
- in most cases we want to be able to tell something about a phenomena in a population
- to do so we use statistical inference which is used to draw conclusions on the population based on
a representative sample
- in statistics the term inference refers to the generalisation of observations, characteristics or traits
- a variable is a characteristic of a sampling unit, which varies between the units
• in the eating disorder research, the EDQ score is a variable and the score on the EDQ varies
from person to person
• this does not mean that two people cannot have the same EDQ score
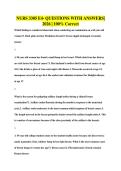
- the distribution of a variable tells us how often a particular test score occurs or what the chance is
of a certain test score
- sometimes data is normally distributed as shown above but the shape also differs from sample to
sample
- the variance and the standard deviation give an indication of the extent to which the data is
scattered
Page 1
, - the descriptive statistics we use to describe a distribution of test scores are also called parameters
- the normal distribution has two parameters (mean score and the standard deviation)t
- parameter estimations differ between samples because every sample contains different sampling
units
- the standard error of a parameter estimation is important because it portrays how precise an
estimation is
^) = σ^/ √N
s.e.(μ
- a standard error of a parameter can be interpreted as the standard deviation of a parameter
estimation over multiple replications
- we use histograms and descriptive statistics to study a variable
- we often want to know if the variables are correlated
- Pearsons r correlation coefficient indicates the strength of a linear relationship between two
variables
- the correlation coefficient is calculated from the covariance between the variables and the
standard deviation of the variables
- the covariance expresses the linear relationship between the variables on the original scales of the
variables
cov(x,y) = rXY = cov(x,y) / (sd(x)*sd(y))
rxy = σxy / (sx * sy)
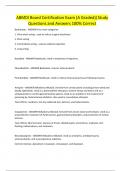
- if we have more than two variables we can summarise the linear relationships with a covariance
matrix
- variances are visible on the diagonal
• the variance of vocabulary is 135.292
Page 2
Chapter 1
- in most cases we want to be able to tell something about a phenomena in a population
- to do so we use statistical inference which is used to draw conclusions on the population based on
a representative sample
- in statistics the term inference refers to the generalisation of observations, characteristics or traits
- a variable is a characteristic of a sampling unit, which varies between the units
• in the eating disorder research, the EDQ score is a variable and the score on the EDQ varies
from person to person
• this does not mean that two people cannot have the same EDQ score
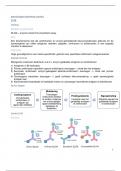
- the distribution of a variable tells us how often a particular test score occurs or what the chance is
of a certain test score
- sometimes data is normally distributed as shown above but the shape also differs from sample to
sample
- the variance and the standard deviation give an indication of the extent to which the data is
scattered
Page 1
, - the descriptive statistics we use to describe a distribution of test scores are also called parameters
- the normal distribution has two parameters (mean score and the standard deviation)t
- parameter estimations differ between samples because every sample contains different sampling
units
- the standard error of a parameter estimation is important because it portrays how precise an
estimation is
^) = σ^/ √N
s.e.(μ
- a standard error of a parameter can be interpreted as the standard deviation of a parameter
estimation over multiple replications
- we use histograms and descriptive statistics to study a variable
- we often want to know if the variables are correlated
- Pearsons r correlation coefficient indicates the strength of a linear relationship between two
variables
- the correlation coefficient is calculated from the covariance between the variables and the
standard deviation of the variables
- the covariance expresses the linear relationship between the variables on the original scales of the
variables
cov(x,y) = rXY = cov(x,y) / (sd(x)*sd(y))
rxy = σxy / (sx * sy)
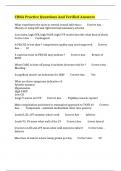
- if we have more than two variables we can summarise the linear relationships with a covariance
matrix
- variances are visible on the diagonal
• the variance of vocabulary is 135.292
Page 2