DAQ – How to report SPSS results
Describing participant group
- 100 respondents (all high school pupils from 5 HAVO, 5 VWO or 6 VWO) were randomly
assigned to one of the two versions of the Biology text and asked to evaluate the text
afterwards. One respondent, however, showed straightlining behavior providing the same
score to all 14 attitude questions. This respondent was therefore removed from the dataset.
- Of the remaining participants, 46 were male and 52 female (1 respondent did not enter
his/her gender). The average age of respondents was 16.53 (SD = 0.72). Of the respondents,
35 had a culture and society profile, 44 had an economy and society profile, 8 had a nature
and technique profile and 12 followed a nature & health profile
Factor analysis: varimax rotation
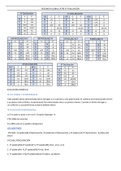
- The factor structure was assessed by performing a principal component analysis with
Varimax rotation. The results of this analysis are specified in Table 1.
- “The analysis revealed four factors that together explained 72% of the variance. The four
factors partially matched the predetermined factor structure. The six items that were supposed
to measure “Comprehensibility” indeed clustered well together, as did the set of three
questions that was supposed to measure “quality of the writing style”. The items that were
expected to be related to “evaluation of the content”, however, fall apart into two dimensions:
items measuring “interestingness of the content” (Cont1, Cont2, Cont4) and items measuring
“importance of the content” (Cont3, Cont5). Hence one’s personal evaluation of the
interestingness of the content is - apparently - something else than the general importance of
the topic.”
KMO & Bartlett’s test
- “Before interpreting the results of the factor analysis, we checked if factor analysis is an
appropriate technique to use for clustering the data. Bartlett’s test is significant (p < .001)
indicating that the variables in the dataset are indeed related. Moreover, with a value of .68,
KMO’s measure for sampling adequacy is well above the 0.5 minimum value, which means
that a substantial proportion of the variance can be accounted for by the factors. Hence, we
can proceed by interpreting the factor structure.”
Describing participant group
- 100 respondents (all high school pupils from 5 HAVO, 5 VWO or 6 VWO) were randomly
assigned to one of the two versions of the Biology text and asked to evaluate the text
afterwards. One respondent, however, showed straightlining behavior providing the same
score to all 14 attitude questions. This respondent was therefore removed from the dataset.
- Of the remaining participants, 46 were male and 52 female (1 respondent did not enter
his/her gender). The average age of respondents was 16.53 (SD = 0.72). Of the respondents,
35 had a culture and society profile, 44 had an economy and society profile, 8 had a nature
and technique profile and 12 followed a nature & health profile
Factor analysis: varimax rotation
- The factor structure was assessed by performing a principal component analysis with
Varimax rotation. The results of this analysis are specified in Table 1.
- “The analysis revealed four factors that together explained 72% of the variance. The four
factors partially matched the predetermined factor structure. The six items that were supposed
to measure “Comprehensibility” indeed clustered well together, as did the set of three
questions that was supposed to measure “quality of the writing style”. The items that were
expected to be related to “evaluation of the content”, however, fall apart into two dimensions:
items measuring “interestingness of the content” (Cont1, Cont2, Cont4) and items measuring
“importance of the content” (Cont3, Cont5). Hence one’s personal evaluation of the
interestingness of the content is - apparently - something else than the general importance of
the topic.”
KMO & Bartlett’s test
- “Before interpreting the results of the factor analysis, we checked if factor analysis is an
appropriate technique to use for clustering the data. Bartlett’s test is significant (p < .001)
indicating that the variables in the dataset are indeed related. Moreover, with a value of .68,
KMO’s measure for sampling adequacy is well above the 0.5 minimum value, which means
that a substantial proportion of the variance can be accounted for by the factors. Hence, we
can proceed by interpreting the factor structure.”