ASSIGNMENT 02 GUIDELINES/SOLUTIONS
DUE DATE: 21 June 2021
UNIQUE NUMBER: 892304
Question 1: (10 marks)
1.1 Discuss the different components (trends or variations) of a time series (4)
Trends
The trend is the long term pattern of a time series. A trend can be positive or
negative depending on whether the time series exhibits an increasing long term
pattern or a decreasing long term pattern. If a time series does not show an
increasing or decreasing pattern then the series is stationary in the mean.
deterministic trend- output of the model is fully determined by the parameter
values and the initial conditions
stochastic trend- inherent randomness
1.2 Explain the difference between stationary and non-stationary stochastic processes
(3)
A stationary time series process is one whose probability distributions are stable over
time. A stochastic process is said to be stationary if its mean and variance are constant
over time; and the value of the covariance between two time periods depends only on
the distance, gap or lag between the two time periods and not the actual time at which
the covariance is computed while a non-stationary time series will have a time-
varying mean and/or a time-varying variance
1.3 In your own words explain what a weakly dependent time series is and how this
can impact the modelling process. (3)
A covariance stationary time series is weakly dependent if the correlation
between xt and xt+h goes to zero “sufficiently quickly” as h → ∞
, As the variables get farther apart in time, the correlation between them becomes
smaller and smaller
Because it replaces the assumption of random sampling in implying that the law of
large numbers (LLN) and the central limit theorem (CLT) hold
Therefore justifies the use of OLS in time series (Read assumptions of OLS)
Question 2: (17 marks)
For the remainder of this assignment you will be required to build an econometric model to track
the development of the JSE All share index.
According to theory, the share price of a company is negatively correlated to changes in interest
rates. Also share prices are often extremely sensitive to changes in the exchange rate as well
as commodity prices.
The quarterly data is provided in the Excel file: ECS4863 2021 Assignment 02 data, which is
available on myUNISA.
Variable names and description:
ALSI = JSE: All Share index - Price index (Index)
TBILL = South Africa Treasury Bill rate (percent per annum)
ZAR = SA Rand to US Dollar exchange rate (quarterly averages)
GOLD = Gold price (USD/oz)
M3 = M3 Money supply (Current prices, R Millions)
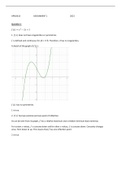
2.1 Provide a graph of the All Share Index. Briefly discuss the main trends (and possible
reasons) you observe. (2)
Figure 1: a graph of the All Share Index
DUE DATE: 21 June 2021
UNIQUE NUMBER: 892304
Question 1: (10 marks)
1.1 Discuss the different components (trends or variations) of a time series (4)
Trends
The trend is the long term pattern of a time series. A trend can be positive or
negative depending on whether the time series exhibits an increasing long term
pattern or a decreasing long term pattern. If a time series does not show an
increasing or decreasing pattern then the series is stationary in the mean.
deterministic trend- output of the model is fully determined by the parameter
values and the initial conditions
stochastic trend- inherent randomness
1.2 Explain the difference between stationary and non-stationary stochastic processes
(3)
A stationary time series process is one whose probability distributions are stable over
time. A stochastic process is said to be stationary if its mean and variance are constant
over time; and the value of the covariance between two time periods depends only on
the distance, gap or lag between the two time periods and not the actual time at which
the covariance is computed while a non-stationary time series will have a time-
varying mean and/or a time-varying variance
1.3 In your own words explain what a weakly dependent time series is and how this
can impact the modelling process. (3)
A covariance stationary time series is weakly dependent if the correlation
between xt and xt+h goes to zero “sufficiently quickly” as h → ∞
, As the variables get farther apart in time, the correlation between them becomes
smaller and smaller
Because it replaces the assumption of random sampling in implying that the law of
large numbers (LLN) and the central limit theorem (CLT) hold
Therefore justifies the use of OLS in time series (Read assumptions of OLS)
Question 2: (17 marks)
For the remainder of this assignment you will be required to build an econometric model to track
the development of the JSE All share index.
According to theory, the share price of a company is negatively correlated to changes in interest
rates. Also share prices are often extremely sensitive to changes in the exchange rate as well
as commodity prices.
The quarterly data is provided in the Excel file: ECS4863 2021 Assignment 02 data, which is
available on myUNISA.
Variable names and description:
ALSI = JSE: All Share index - Price index (Index)
TBILL = South Africa Treasury Bill rate (percent per annum)
ZAR = SA Rand to US Dollar exchange rate (quarterly averages)
GOLD = Gold price (USD/oz)
M3 = M3 Money supply (Current prices, R Millions)
2.1 Provide a graph of the All Share Index. Briefly discuss the main trends (and possible
reasons) you observe. (2)
Figure 1: a graph of the All Share Index