General Linear models: One Factor ANOVA
ANOVA: compares amount of variance within groups (error) to the variance between groups (group
differences)
● One-way ANOVA: single categorical predictor
● Two-way (two factor) ANOVA: two categorical predictors
○ Does handedness and time of day predict reaction times?
■ 2 (left and right) x 2 (A.M and P.M)
Assumptions:
1. Independent observations: are all observations for different people?
2. Equal variance test —> Levene’s test
3. Normally distributed —> qq plot
One-Factor ANOVA: tests hypotheses about mean group differences in situations where we have 2 or
more groups
● Alternative hypothesis: there is a difference between the groups mean test scores
○ H1 : µ1≠ µ2 ≠ µ3
● Null Hypothesis: there is no difference between the groups mean test scores
○ H0 : µ1 = µ2 = µ3
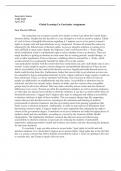
GLM: measures within and between group variance that generalizes to situations with more than one
factor
○
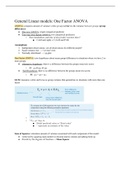
○ ^Yij = μ+Aiμ+Ai
■ Model predicted value or “fitted value"
■ ^ represents an estimate of the value
Sum of Squares: calculates amount of variance associated with each component of the model
● Achieved by squaring each number in decomp matrix column and adding them up
● Divide by the degrees of freedom → Mean Square
, ○ Rationale: sum of squares between group variance will be much larger for small number
of participants in many groups than that for large number of participants in a small
number of groups
Degrees of freedom: number of independent values for a term
● dfA = number of groups -1
● Degrees of freedom for error: dfS(A)= number of participants - number of groups
● Degrees of freedom for overall mean
● dfµ= 1 because there is only 1 mean value
● dfY = total number of data points
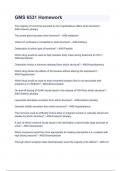
F statistic: ratio of variance due to differences between groups to variance within groups
● How big is the difference between variance for the effect relative to the variance of the error?
● If F is large, grouping variable explains a lot of variation relative to sampling error
○ Not much difference between the groups
● If F is small, group variable explains little of variation relative to sampling error
Case study: A group of 12 runners wanted to know whether what they ate in the morning before their run
impacted their speed.
● 3 groups of 4, where each group ate either banana, toast, or porridge
● 4 people in each 3 groups so 12 GLM equations
○ 1 overall mean
○ 3 group effects
○ 12 error terms
● Procedure
○ Make decomp matrix
○ Calculate mean squares
○ Calculate degrees of freedom: dfeffect= 2; dferror= 9
○ Find mean squares → sum of squares/ degrees of freedom
○ Find F statistic
○ Find P value
● ezANOVA (dat, wid=id, dv=time, between= food, detailed= TRUE)
○ Writeup: There was a significant effect of food on running time; F(1,2) = 12.97, p = .002,
ges= 0.74.
Two Way ANOVA
Two-factor ANOVA: test hypotheses about mean differences in situations where we have more than one factor
● Main effect of A: There is no overall difference between levels of A
● Main effect of B: There is no overall difference between levels of B
, ● Interaction between A and B: The difference between levels of A does not depend on level of B
(same as saying: The difference between levels of B does not depend on level of A).
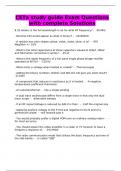
GLM equation
● Interaction= measures the extent to which observed effect of one factor depends on the other
factor
○ is the mean score for each “cell” (combination of the levels of the factor)
○ add up to 0 across each factor (rows and columns)
Degrees of freedom
● Main effects: dfA / dfB = number of levels -1
● Error: dfS(AB)= number of participants - (levels A x levels B)
● Interaction dfAB = dfA x dfB
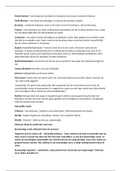
Case Study: How Personality type (introvert vs extrovert) and Type of Motivation (Praise/Blame) affect
performance of a task
● Possible outcomes
1. Effect on motivation, no effect on personality
ANOVA: compares amount of variance within groups (error) to the variance between groups (group
differences)
● One-way ANOVA: single categorical predictor
● Two-way (two factor) ANOVA: two categorical predictors
○ Does handedness and time of day predict reaction times?
■ 2 (left and right) x 2 (A.M and P.M)
Assumptions:
1. Independent observations: are all observations for different people?
2. Equal variance test —> Levene’s test
3. Normally distributed —> qq plot
One-Factor ANOVA: tests hypotheses about mean group differences in situations where we have 2 or
more groups
● Alternative hypothesis: there is a difference between the groups mean test scores
○ H1 : µ1≠ µ2 ≠ µ3
● Null Hypothesis: there is no difference between the groups mean test scores
○ H0 : µ1 = µ2 = µ3
GLM: measures within and between group variance that generalizes to situations with more than one
factor
○
○ ^Yij = μ+Aiμ+Ai
■ Model predicted value or “fitted value"
■ ^ represents an estimate of the value
Sum of Squares: calculates amount of variance associated with each component of the model
● Achieved by squaring each number in decomp matrix column and adding them up
● Divide by the degrees of freedom → Mean Square
, ○ Rationale: sum of squares between group variance will be much larger for small number
of participants in many groups than that for large number of participants in a small
number of groups
Degrees of freedom: number of independent values for a term
● dfA = number of groups -1
● Degrees of freedom for error: dfS(A)= number of participants - number of groups
● Degrees of freedom for overall mean
● dfµ= 1 because there is only 1 mean value
● dfY = total number of data points
F statistic: ratio of variance due to differences between groups to variance within groups
● How big is the difference between variance for the effect relative to the variance of the error?
● If F is large, grouping variable explains a lot of variation relative to sampling error
○ Not much difference between the groups
● If F is small, group variable explains little of variation relative to sampling error
Case study: A group of 12 runners wanted to know whether what they ate in the morning before their run
impacted their speed.
● 3 groups of 4, where each group ate either banana, toast, or porridge
● 4 people in each 3 groups so 12 GLM equations
○ 1 overall mean
○ 3 group effects
○ 12 error terms
● Procedure
○ Make decomp matrix
○ Calculate mean squares
○ Calculate degrees of freedom: dfeffect= 2; dferror= 9
○ Find mean squares → sum of squares/ degrees of freedom
○ Find F statistic
○ Find P value
● ezANOVA (dat, wid=id, dv=time, between= food, detailed= TRUE)
○ Writeup: There was a significant effect of food on running time; F(1,2) = 12.97, p = .002,
ges= 0.74.
Two Way ANOVA
Two-factor ANOVA: test hypotheses about mean differences in situations where we have more than one factor
● Main effect of A: There is no overall difference between levels of A
● Main effect of B: There is no overall difference between levels of B
, ● Interaction between A and B: The difference between levels of A does not depend on level of B
(same as saying: The difference between levels of B does not depend on level of A).
GLM equation
● Interaction= measures the extent to which observed effect of one factor depends on the other
factor
○ is the mean score for each “cell” (combination of the levels of the factor)
○ add up to 0 across each factor (rows and columns)
Degrees of freedom
● Main effects: dfA / dfB = number of levels -1
● Error: dfS(AB)= number of participants - (levels A x levels B)
● Interaction dfAB = dfA x dfB
Case Study: How Personality type (introvert vs extrovert) and Type of Motivation (Praise/Blame) affect
performance of a task
● Possible outcomes
1. Effect on motivation, no effect on personality