SPSS CHEATSHEET
, WEEK 1 – MRA
EXERCISE 1.1
Reminder: Y (dependent variable) is regressed on X (predictor/independent variable)!
Perform a Linear Regression of Y on X
Always check for outlier before by sorting “Descending” COO_1 should be <1
COO_1 Cook’s D
Use the file MVDA_MRA_1.sav. In a study with middle-class children (11-13
years old), educational psychologists investigated whether academic
performance (GPA) (Y/dependent variable) can be predicted IQ(X1),
age(X2), gender(X3) and/or self-concept(X4).
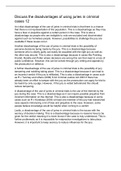
Calculate the Pearson correlations between the five variables. Analyze
Correlate Bivariate Put all variables into “Variables”. Look at
“Correlations” table.
a) What is the sample size N? Look at “Correlations” table “N”
b) Does it make sense to perform a linear regression of GPA on IQ, age,
gender and/or self-concept? Look at “Correlations” table “Pearson
Correlation”
c) Which variable is likely to be a good predictor of GPA? Look at
“Correlations” table “Sig (2-tailed)” should be < .001
Next, perform a linear regression of GPA (Y/dependent) on IQ(X1),
age(X2), gender(X3) and self-concept(X4). In Statistics, ask for part and
partial correlations, and collinearity diagnostics. In Save ask for Cook’s
distances and Leverage values. Analyze Regression Linear Put Y
variable to “Dependent” and X variables to “Independent”.
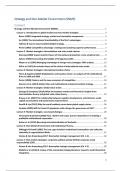
d) Can the null hypothesis of no relationship between GPA and IQ, age,
gender and/or self-concept be rejected? Look at the “ANOVA” table
write F (df1, df2) and p value < .001.
e) How much variance of GPA is explained by IQ, age, gender and SC
together? “Model Summary” R2 = variance of predictors combined
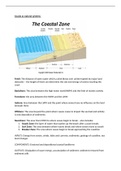
f) What predictor explains the most unique variance? Look at
“Coefficients” table “Correlations” “Part” CORRELATION (R)!
THEREFORE, SQUARE IT ( R2 ¿ ! THEN IT BECOMES THE VARIANCE. WRITE
THE NAME, AND ALSO THE PART CORRELATION
FOR EX: CONFID1, part: .418
g) Is there evidence of multicollinearity (dependency between the
predictors) in the predictors? Look at “Coefficients” Collinearity
Statistics VIF < 10 and Tolerance > 0.1
, WEEK 1 – MRA
EXERCISE 1.1
Reminder: Y (dependent variable) is regressed on X (predictor/independent variable)!
Perform a Linear Regression of Y on X
Always check for outlier before by sorting “Descending” COO_1 should be <1
COO_1 Cook’s D
Use the file MVDA_MRA_1.sav. In a study with middle-class children (11-13
years old), educational psychologists investigated whether academic
performance (GPA) (Y/dependent variable) can be predicted IQ(X1),
age(X2), gender(X3) and/or self-concept(X4).
Calculate the Pearson correlations between the five variables. Analyze
Correlate Bivariate Put all variables into “Variables”. Look at
“Correlations” table.
a) What is the sample size N? Look at “Correlations” table “N”
b) Does it make sense to perform a linear regression of GPA on IQ, age,
gender and/or self-concept? Look at “Correlations” table “Pearson
Correlation”
c) Which variable is likely to be a good predictor of GPA? Look at
“Correlations” table “Sig (2-tailed)” should be < .001
Next, perform a linear regression of GPA (Y/dependent) on IQ(X1),
age(X2), gender(X3) and self-concept(X4). In Statistics, ask for part and
partial correlations, and collinearity diagnostics. In Save ask for Cook’s
distances and Leverage values. Analyze Regression Linear Put Y
variable to “Dependent” and X variables to “Independent”.
d) Can the null hypothesis of no relationship between GPA and IQ, age,
gender and/or self-concept be rejected? Look at the “ANOVA” table
write F (df1, df2) and p value < .001.
e) How much variance of GPA is explained by IQ, age, gender and SC
together? “Model Summary” R2 = variance of predictors combined
f) What predictor explains the most unique variance? Look at
“Coefficients” table “Correlations” “Part” CORRELATION (R)!
THEREFORE, SQUARE IT ( R2 ¿ ! THEN IT BECOMES THE VARIANCE. WRITE
THE NAME, AND ALSO THE PART CORRELATION
FOR EX: CONFID1, part: .418
g) Is there evidence of multicollinearity (dependency between the
predictors) in the predictors? Look at “Coefficients” Collinearity
Statistics VIF < 10 and Tolerance > 0.1