MAC2601 FORMULAS:
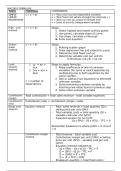
TOPIC FORMULA COMPONENTS
SIMPLE y = a + bx y = Total cost incurred (dependent variable)
LINEAR a = Total fixed cost (where straight line intercept y )
REGRESSION b = Total var cost p/u (slope of straight line)
x = Level of activity (independent variable)
High – Low y = a + bx Steps:
method 1. Select highest and lowest activity points
2. Use points, calculate slope of curve
3. Use slope, calculate y-intercept
4. Form cost equation
Scatter y = a + bx Steps:
graph 1. Plotting scatter graph
method 2. Draw regression line and extend to y-axis
3. Determine total fixed cost (a)
4. Determine variable cost per unit (b)
4.1Formula: (y2-y1) / (x2-x1)
Least 1. y = an + Steps to apply formulas:
squares bx 1. Make coefficients of one of unknown
method 2. xy = ax + variables the same or exact opposites by
bx² multiplying one or both equations by the
same number
2. Add or subtract two equations to eliminate
n = number of unknown variable
observations 3. Solve remaining unknown variable by
inserting new value found in previous step
4. Solve other unknown variable
Contribution Total contribution = total sales revenue – total variable expenses
margin
Contribution Contribution ratio = contribution margin / sales
ratio
Break even Equation method - Total sales revenue = total quantity (Q) x
analysis selling price per unit (SPU)
- Total variable costs = total quantity (Q) x
variable costs per unit (VCU)
- Expanded equation for net profit:
(Q x SPU) – (Q x VCU) – TFC = P
Remember breakeven is where profit = 0, thus P
=0
Contribution margin - Total revenue – total variable cost
method - Contribution margin per unit (CMU) = Selling
price per unit (SPU) – variable cost per unit
(VCU)
- Equation method restated as:
(Q x SPU) – (Q x VCU) – TFC = P
Q = (SPU – VCU) – TFC = P
Q = (CMU) = P + TFC
Q = (P + TFC) / CMU
- Breakeven quantity = total fixed costs /