, Principles of Data Science
Chapter 4
Inferential Statistics and Regression Analysis
Critical Thinking Questions
[4.1, LO 4.1.1]
1. An automotive designer wants to create a 90% confidence interval for the mean length of a
body panel on a new model electric vehicle. From a sample of 35 cars, the sample mean length
is 37 cm and the sample standard deviation is 2.8 cm.
a. Create a 90% confidence interval for the population mean length of the body panel
using Python.
b. Create a 90% confidence interval for the population mean length of the body panel
using Excel.
c. Create a 95% confidence interval for the population mean length of the body panel
using Python.
d. Create a 95% confidence interval for the population mean length of the body panel
using Excel.
e. Which confidence interval is narrower, the 90% or 95% confidence interval?
Solution a: A confidence interval for the mean when the population standard deviation is
unknown can be calculated using the Python t-interval() function.
import scipy.stats as stats
from scipy.stats import t
import numpy as np
import math
# Enter sample mean, sample standard deviation, and sample size
sample_mean = 37
sample_standard_deviation = 2.8
sample_size = 35
# Degrees of freedom (sample size - 1)
degrees_of_freedom = sample_size - 1
# Confidence level
confidence_level = 0.90
# standard error
standard_error = sample_standard_deviation / math.sqrt(sample_size)
# Calculate confidence interval using t.interval function
t.interval(confidence_level, degrees_of_freedom, sample_mean,
standard_error)
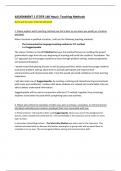
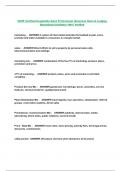
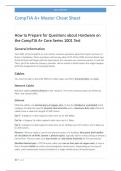
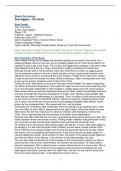
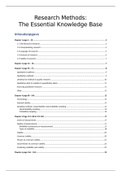
The resulting output will look like this:
11/11/24 For more free, peer-reviewed, openly licensed resources visit OpenStax.org. 2
Chapter 4
Inferential Statistics and Regression Analysis
Critical Thinking Questions
[4.1, LO 4.1.1]
1. An automotive designer wants to create a 90% confidence interval for the mean length of a
body panel on a new model electric vehicle. From a sample of 35 cars, the sample mean length
is 37 cm and the sample standard deviation is 2.8 cm.
a. Create a 90% confidence interval for the population mean length of the body panel
using Python.
b. Create a 90% confidence interval for the population mean length of the body panel
using Excel.
c. Create a 95% confidence interval for the population mean length of the body panel
using Python.
d. Create a 95% confidence interval for the population mean length of the body panel
using Excel.
e. Which confidence interval is narrower, the 90% or 95% confidence interval?
Solution a: A confidence interval for the mean when the population standard deviation is
unknown can be calculated using the Python t-interval() function.
import scipy.stats as stats
from scipy.stats import t
import numpy as np
import math
# Enter sample mean, sample standard deviation, and sample size
sample_mean = 37
sample_standard_deviation = 2.8
sample_size = 35
# Degrees of freedom (sample size - 1)
degrees_of_freedom = sample_size - 1
# Confidence level
confidence_level = 0.90
# standard error
standard_error = sample_standard_deviation / math.sqrt(sample_size)
# Calculate confidence interval using t.interval function
t.interval(confidence_level, degrees_of_freedom, sample_mean,
standard_error)
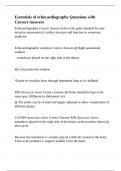
The resulting output will look like this:
11/11/24 For more free, peer-reviewed, openly licensed resources visit OpenStax.org. 2