Statistics BIBLE
Inhoudsopgave
Defining the variables:................................................................................................................................... 2
How to choose the right test.......................................................................................................................... 2
Extra examples for choosing the right test based on hypothesis.........................................................................4
First steps before performing a test:.............................................................................................................. 5
Performing an One samples T-test............................................................................................................... 10
Performing an Independent t-test................................................................................................................ 12
Performing a Dependent t-test..................................................................................................................... 14
Performing a One-way ANOVA..................................................................................................................... 16
Post hoc (7.1)......................................................................................................................................................17
Planned contrasts (7.2).......................................................................................................................................18
Performing a Factorial ANOVA..................................................................................................................... 22
Simple effects (always) (8.1)...............................................................................................................................23
Contrasts (only to explore a main effect on a IV with 3 or more levels) (8.2)....................................................25
Performing a Chi square............................................................................................................................... 28
Performing a Correlation.............................................................................................................................. 31
Partial correlations.............................................................................................................................................33
Performing a Regression.............................................................................................................................. 36
For all test is a step by step plan provided on how to perform
a test well. It tells you exactly what to do at what time of the
test. Also, information on when it has to be bootstrapped etc.
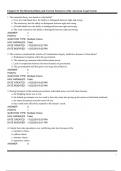
,Defining the variables:
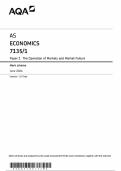
How to choose the right test
One-sample t-test: (1 value and 1 continuous variable)
Compares the mean of a group against a fixed value.
- E.g., testing whether a score is higher than a population mean, or lower than the
mid-point of the scale
- to test whether the average reaction time of a group is different from an external
value, for example, people with dementia versus the general population average.
,Independent t-test (1 continuous variable and 1 categorical variable of 2 levels)
Compares two means based on independent data
- E.g., data from different groups of people (no overlap; e.g., gender)
- E.g., Are children of divorced parents unhappier than children whose parents are not
divorced?
- E.g., are men greedier than women?
- E.g., are men more sure of their answer than women?
Dependent t-test (1 continuous variable and 1 categorical variable of 2 levels)
Compares two means based on related data. (here: the same measure taken twice from the
same group, but may also be two measurements taken once from a matched group (e.g.,
couples, parent-child dyads, ...))
E.g., Data from the same people measured at different times (a ‘within person’, ‘within-
observation’-design)
Data from ‘matched’ samples (e.g., parent-child couples)
- E.g. Are parents and children alike in their attitude about death penalty?
- Y1= parental attitude Y2 = child attitude]
- E.g., do people perform better at reaction time tests after eating sugar?
- Y1= performance BEFORE manipulation Y2 = performance AFTER manipulation
One-way ANOVA (1 continuous variable and 1 categorical variable of 3 or more levels)
Compares the means of multiple groups
Between-subjects design
IV: 1 categorical var; DV = 1 continuous var
- E.g., Control vs. Low vs. High?
- E.g., Task feedback effects: None, positive feedback, negative feedback
- E.g. Testing the effects of Viagra (three groups) on Libido
Factorial ANOVA (1 continuous variable and 2 categorical variables with 2 or more levels)
The multiple groups result from combining multiple independent variables
- e.g., Continuous outcome variable (at least interval)
o number of phone numbers collected by the end of the evening
Two (in this course binary) independent variables
o gender and drinks alcohol or not
- E.g., Control vs. Experimental + male vs. Female
- E.g., Impact of testosterone injections on depression
- E.g. Testing the effects of Alcohol (2 or 3 levels) and Gender (2 levels) on ‘thebeer-
goggleseffect’(continuous):
-
Chi square test (2 categorical variables)
Relationship between Categorical outcome variable
- E.g. Were Democrats more likely to vote for Hillary Clinton versus for Donald Trump
than Republicans?
- E.g. Are women more likely to have used the hashtag #metoo(yes/no) than men?
,Correlation (2 continuous variables)
It measures the degree to which two continuous variables are linearly related
- e.g. There is a relationship between X and Y
- e.g. shoes and height
- e.g. Exam performance (%) and Exam Anxiety (the EAQ, score out of 100)
Regression (2 continuous variables, prediction)
A way of predicting the value of one variable from another using a linear line.
- e.g. Taller people have larger shoe sizes
- e.g. If I would eat fast food three times a day, what would my weight-increase be
Extra examples for choosing the right test based on
hypothesis
Do men require more time (measured in seconds) to prepare a meal than women?
T-test
Does the amount of money in people's bank account predict the number of products they
buy?
Regression
Is there a relationship between having a partner and having a depression (vs. not having
one)?
Chi square
does taking drugs (yes/no) and drinking alcohol (yes/no) make people dance longer?
Factorial ANOVA
Do people generally like Riri more than Drake? (likeability measured with 5 items)
Paired samples t-test
Does the nr of fruits people eat during 6 months relate to their weight loss (in grams)?
Correlation
Do blondes have more fun (mean score of 7 Likert-scale items) than brunettes and
redheads?
One-way ANOVA
Can men with a beard gather more phone numbers of girls in a bar than men without a
beard?
Independent t-test
,Does the nr of hours TV viewing/week predict people's perception of the chance to get
murdered?
Regression
How do having kids and/or having pets affect the degree of hygiene in people's household?
Factorial ANOVA
Does the number of partners relate to the nr of psychiatric illnesses people have in life?
Correlation
Do people who fail statistics evaluate the course teachers more negatively?
Independent t-test
What is the relationship between wearing make-up or not and having a romantic partner or
not?
Chi square
Do stats teachers have better humor (7 Likert-scale items) than language and gym teachers?
One-way ANOVA
Does the hours spent studying predict students' grades?
Regression
Are this year's premasters smarter than last year's based on their stats grade (last year: 6.4)
One-samples t-test
First steps before performing a test:
1. Get your data ready
a. Check if variables need to be recoded
b. Check reliability of scales
c. Compute mean values or other necessary variables
2. Explore your data (with graphs)
a. Look at the distribution and the means
b. Check for outliers
3. Check whether assumptions of the test are met
4. Perform the main analyses
5. Calculate the effect size
6. Report
, 1. Get your data ready
When reliability?
Whenever you are combining multiple variables into one (Mean) variable
Steps:
- Check carefully in the description if a variable needs to be recoded.
- First recode the variables and pay attention to the values (1-7, 2-6, etc.) via recode
into different variables (new variable with an r)
- Check reliability of the scale (including the recoded variables) with Cronbach’s Alpha
via scale > reliability analysis
- Cronbach’s Alpha above α .7 is good
- Compute a mean of the scale via compute variable > statistics > mean > insert all
variables of the scale
- Report:
o How many items are in the scale
o Measured on what type of Likert Scale
o An example item
o The Cronbach Alpha value (“scale was internally consistent”)
o The general descriptives (M, SD) of the scale variable that you computed
2. Explore your data (with graphs)
- Outliers don’t exclude them in the exam!
- Use explore function to get the descriptives
- When you have to create equally large groups based on the data. You can ask SPSS to
give you the cut-points using the ''Frequencies > Statistics > Cut points for X equal
groups>recode into different variables based on this data”
3. Check whether assumptions are met
- Check the right assumptions per test! (these are provided for each test)
- Only mention them if not met and asked for
General information about skewness and kurtosis:
Skew
- The symmetry of the distribution.
o Positive skew (scores bunched at low values with the tail pointing to high
values; or tail-to-right).
o Negative skew (scores bunched at high values with the tail pointing to low
values; or tail-to-left).
Kurtosis
- The ‘heaviness’ of the tails.
o Leptokurtic = high peak, ‘heavy’ tails.
o Platykurtic = low peak, ‘light’ tails.
Skewness and kurtosis are met if they are between the interval of -1.96 to + 1.96.
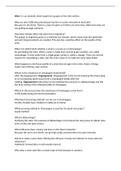
,The variance ratio. As a rule of thumb, you can say that if it is smaller than 2, you are fine. If
it is larger, you can use this table to check whether it is fine:
N = number of people in the group
K= number of groups
4. Perform the main analyses
- Don’t forget all steps of the test, also the additionally test (e.g. Post hoc, simple
effects)
5. Calculate the effect size
- Choose the right effect size
- Always report effect size even if not significant
- Use the excel sheet
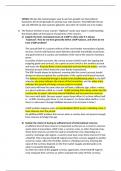
,Specific effect size calculations or report rules:
One sample t-test: (mean – testvalue) / std. deviation
Paired samples t-test: report Cohen’s dav
Correlation: r2 = square the value of r
Chi square:
a. ODDS (Clinton, given female) = females voted for Clinton/females voted for Trump
b. ODDS (Clinton, given male) = male voted for Clinton/male voted for Trumpc.
ODDS RATIO = a/b
Effect size indicator:
, 6. Report
- Choose the right result section description
To describe in description before you describe the outcomes of the test:
- For description before
- description of the model:
- Direction of the DV:
- Scale reliability:
- Number of questions:
- Example item:
- Scale:
- Anchors/direction:
- Descriptive statistics in context:
- Assumptions:
Example where scale has to be computed:
To investigate whether interpersonal interest predicts the adequacy of people's ratings of
gift preferences (as measured with the gift selection index) we built a regression model with
the score on interpersonal interest as independent variable and the gift selection index as
dependent variable. Note that the gift selection index measures the distance between the
predicted and the actual preferences, so lower scores indicate better gift selection quality.
The interpersonal interest scale had a good reliability (α = .80). It was measured with 28
questions (e.g. I prefer to do things with others rather than on my own) on a 7 point scale (1
= extremely disagree, 7 = extremely agree).
The mean score on the interpersonal interest scale was 5.01 (SD = 0.55), on a 7-point
scale. The average distance between the predicted and the actual gift preferences was 17.45
(SD = 5.28). Given that there were 10 gift certificates to rank order, the score can vary
between 0 and 50 with 25 as the expected average if people would guess randomly.
, Performing an One samples T-test
We know the true population mean μ
We want to know if the mean of our sample deviates significantly from μ
Steps:
1. Get data ready (Recode, reliability, and computing)
2. Test assumption of normality
a. Calculate the Z-scores of skewness and kurtosis of the dependent variable
b. If violated, bootstrap the test and report BCA
3. Perform one-samples t-test: Compare means > one-samples t-test
a. Put variable in column
b. Add the fixed value in test value
c. Bootstrap if needed
4. Test if it’s significant.
a. < 0.05 = significant
b. Bootstrap CI do not cross zero = significant
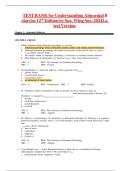
5. Calculate effect size manual
a.
b. M = mean, u = fixed value, s = std. deviation
c. See effect size figure to check if it’s small/medium/large
6. Report (not italicized etc)
To test whether correctness judgments for real words were above chance level (50%) I
performed a one sample t-test. On average, the correctness of judgments (M = 73.70, SD
= 15.70) was significantly different from 50, Mdif = 23.70, t(93) = 14.63, p < .001. The
difference represents a large-sized effect d = 1.51. Thus, the hypothesis that people are
more than 50% correct in their correctness judgments for real words is supported by the
data.
Inhoudsopgave
Defining the variables:................................................................................................................................... 2
How to choose the right test.......................................................................................................................... 2
Extra examples for choosing the right test based on hypothesis.........................................................................4
First steps before performing a test:.............................................................................................................. 5
Performing an One samples T-test............................................................................................................... 10
Performing an Independent t-test................................................................................................................ 12
Performing a Dependent t-test..................................................................................................................... 14
Performing a One-way ANOVA..................................................................................................................... 16
Post hoc (7.1)......................................................................................................................................................17
Planned contrasts (7.2).......................................................................................................................................18
Performing a Factorial ANOVA..................................................................................................................... 22
Simple effects (always) (8.1)...............................................................................................................................23
Contrasts (only to explore a main effect on a IV with 3 or more levels) (8.2)....................................................25
Performing a Chi square............................................................................................................................... 28
Performing a Correlation.............................................................................................................................. 31
Partial correlations.............................................................................................................................................33
Performing a Regression.............................................................................................................................. 36
For all test is a step by step plan provided on how to perform
a test well. It tells you exactly what to do at what time of the
test. Also, information on when it has to be bootstrapped etc.
,Defining the variables:
How to choose the right test
One-sample t-test: (1 value and 1 continuous variable)
Compares the mean of a group against a fixed value.
- E.g., testing whether a score is higher than a population mean, or lower than the
mid-point of the scale
- to test whether the average reaction time of a group is different from an external
value, for example, people with dementia versus the general population average.
,Independent t-test (1 continuous variable and 1 categorical variable of 2 levels)
Compares two means based on independent data
- E.g., data from different groups of people (no overlap; e.g., gender)
- E.g., Are children of divorced parents unhappier than children whose parents are not
divorced?
- E.g., are men greedier than women?
- E.g., are men more sure of their answer than women?
Dependent t-test (1 continuous variable and 1 categorical variable of 2 levels)
Compares two means based on related data. (here: the same measure taken twice from the
same group, but may also be two measurements taken once from a matched group (e.g.,
couples, parent-child dyads, ...))
E.g., Data from the same people measured at different times (a ‘within person’, ‘within-
observation’-design)
Data from ‘matched’ samples (e.g., parent-child couples)
- E.g. Are parents and children alike in their attitude about death penalty?
- Y1= parental attitude Y2 = child attitude]
- E.g., do people perform better at reaction time tests after eating sugar?
- Y1= performance BEFORE manipulation Y2 = performance AFTER manipulation
One-way ANOVA (1 continuous variable and 1 categorical variable of 3 or more levels)
Compares the means of multiple groups
Between-subjects design
IV: 1 categorical var; DV = 1 continuous var
- E.g., Control vs. Low vs. High?
- E.g., Task feedback effects: None, positive feedback, negative feedback
- E.g. Testing the effects of Viagra (three groups) on Libido
Factorial ANOVA (1 continuous variable and 2 categorical variables with 2 or more levels)
The multiple groups result from combining multiple independent variables
- e.g., Continuous outcome variable (at least interval)
o number of phone numbers collected by the end of the evening
Two (in this course binary) independent variables
o gender and drinks alcohol or not
- E.g., Control vs. Experimental + male vs. Female
- E.g., Impact of testosterone injections on depression
- E.g. Testing the effects of Alcohol (2 or 3 levels) and Gender (2 levels) on ‘thebeer-
goggleseffect’(continuous):
-
Chi square test (2 categorical variables)
Relationship between Categorical outcome variable
- E.g. Were Democrats more likely to vote for Hillary Clinton versus for Donald Trump
than Republicans?
- E.g. Are women more likely to have used the hashtag #metoo(yes/no) than men?
,Correlation (2 continuous variables)
It measures the degree to which two continuous variables are linearly related
- e.g. There is a relationship between X and Y
- e.g. shoes and height
- e.g. Exam performance (%) and Exam Anxiety (the EAQ, score out of 100)
Regression (2 continuous variables, prediction)
A way of predicting the value of one variable from another using a linear line.
- e.g. Taller people have larger shoe sizes
- e.g. If I would eat fast food three times a day, what would my weight-increase be
Extra examples for choosing the right test based on
hypothesis
Do men require more time (measured in seconds) to prepare a meal than women?
T-test
Does the amount of money in people's bank account predict the number of products they
buy?
Regression
Is there a relationship between having a partner and having a depression (vs. not having
one)?
Chi square
does taking drugs (yes/no) and drinking alcohol (yes/no) make people dance longer?
Factorial ANOVA
Do people generally like Riri more than Drake? (likeability measured with 5 items)
Paired samples t-test
Does the nr of fruits people eat during 6 months relate to their weight loss (in grams)?
Correlation
Do blondes have more fun (mean score of 7 Likert-scale items) than brunettes and
redheads?
One-way ANOVA
Can men with a beard gather more phone numbers of girls in a bar than men without a
beard?
Independent t-test
,Does the nr of hours TV viewing/week predict people's perception of the chance to get
murdered?
Regression
How do having kids and/or having pets affect the degree of hygiene in people's household?
Factorial ANOVA
Does the number of partners relate to the nr of psychiatric illnesses people have in life?
Correlation
Do people who fail statistics evaluate the course teachers more negatively?
Independent t-test
What is the relationship between wearing make-up or not and having a romantic partner or
not?
Chi square
Do stats teachers have better humor (7 Likert-scale items) than language and gym teachers?
One-way ANOVA
Does the hours spent studying predict students' grades?
Regression
Are this year's premasters smarter than last year's based on their stats grade (last year: 6.4)
One-samples t-test
First steps before performing a test:
1. Get your data ready
a. Check if variables need to be recoded
b. Check reliability of scales
c. Compute mean values or other necessary variables
2. Explore your data (with graphs)
a. Look at the distribution and the means
b. Check for outliers
3. Check whether assumptions of the test are met
4. Perform the main analyses
5. Calculate the effect size
6. Report
, 1. Get your data ready
When reliability?
Whenever you are combining multiple variables into one (Mean) variable
Steps:
- Check carefully in the description if a variable needs to be recoded.
- First recode the variables and pay attention to the values (1-7, 2-6, etc.) via recode
into different variables (new variable with an r)
- Check reliability of the scale (including the recoded variables) with Cronbach’s Alpha
via scale > reliability analysis
- Cronbach’s Alpha above α .7 is good
- Compute a mean of the scale via compute variable > statistics > mean > insert all
variables of the scale
- Report:
o How many items are in the scale
o Measured on what type of Likert Scale
o An example item
o The Cronbach Alpha value (“scale was internally consistent”)
o The general descriptives (M, SD) of the scale variable that you computed
2. Explore your data (with graphs)
- Outliers don’t exclude them in the exam!
- Use explore function to get the descriptives
- When you have to create equally large groups based on the data. You can ask SPSS to
give you the cut-points using the ''Frequencies > Statistics > Cut points for X equal
groups>recode into different variables based on this data”
3. Check whether assumptions are met
- Check the right assumptions per test! (these are provided for each test)
- Only mention them if not met and asked for
General information about skewness and kurtosis:
Skew
- The symmetry of the distribution.
o Positive skew (scores bunched at low values with the tail pointing to high
values; or tail-to-right).
o Negative skew (scores bunched at high values with the tail pointing to low
values; or tail-to-left).
Kurtosis
- The ‘heaviness’ of the tails.
o Leptokurtic = high peak, ‘heavy’ tails.
o Platykurtic = low peak, ‘light’ tails.
Skewness and kurtosis are met if they are between the interval of -1.96 to + 1.96.
,The variance ratio. As a rule of thumb, you can say that if it is smaller than 2, you are fine. If
it is larger, you can use this table to check whether it is fine:
N = number of people in the group
K= number of groups
4. Perform the main analyses
- Don’t forget all steps of the test, also the additionally test (e.g. Post hoc, simple
effects)
5. Calculate the effect size
- Choose the right effect size
- Always report effect size even if not significant
- Use the excel sheet
,Specific effect size calculations or report rules:
One sample t-test: (mean – testvalue) / std. deviation
Paired samples t-test: report Cohen’s dav
Correlation: r2 = square the value of r
Chi square:
a. ODDS (Clinton, given female) = females voted for Clinton/females voted for Trump
b. ODDS (Clinton, given male) = male voted for Clinton/male voted for Trumpc.
ODDS RATIO = a/b
Effect size indicator:
, 6. Report
- Choose the right result section description
To describe in description before you describe the outcomes of the test:
- For description before
- description of the model:
- Direction of the DV:
- Scale reliability:
- Number of questions:
- Example item:
- Scale:
- Anchors/direction:
- Descriptive statistics in context:
- Assumptions:
Example where scale has to be computed:
To investigate whether interpersonal interest predicts the adequacy of people's ratings of
gift preferences (as measured with the gift selection index) we built a regression model with
the score on interpersonal interest as independent variable and the gift selection index as
dependent variable. Note that the gift selection index measures the distance between the
predicted and the actual preferences, so lower scores indicate better gift selection quality.
The interpersonal interest scale had a good reliability (α = .80). It was measured with 28
questions (e.g. I prefer to do things with others rather than on my own) on a 7 point scale (1
= extremely disagree, 7 = extremely agree).
The mean score on the interpersonal interest scale was 5.01 (SD = 0.55), on a 7-point
scale. The average distance between the predicted and the actual gift preferences was 17.45
(SD = 5.28). Given that there were 10 gift certificates to rank order, the score can vary
between 0 and 50 with 25 as the expected average if people would guess randomly.
, Performing an One samples T-test
We know the true population mean μ
We want to know if the mean of our sample deviates significantly from μ
Steps:
1. Get data ready (Recode, reliability, and computing)
2. Test assumption of normality
a. Calculate the Z-scores of skewness and kurtosis of the dependent variable
b. If violated, bootstrap the test and report BCA
3. Perform one-samples t-test: Compare means > one-samples t-test
a. Put variable in column
b. Add the fixed value in test value
c. Bootstrap if needed
4. Test if it’s significant.
a. < 0.05 = significant
b. Bootstrap CI do not cross zero = significant
5. Calculate effect size manual
a.
b. M = mean, u = fixed value, s = std. deviation
c. See effect size figure to check if it’s small/medium/large
6. Report (not italicized etc)
To test whether correctness judgments for real words were above chance level (50%) I
performed a one sample t-test. On average, the correctness of judgments (M = 73.70, SD
= 15.70) was significantly different from 50, Mdif = 23.70, t(93) = 14.63, p < .001. The
difference represents a large-sized effect d = 1.51. Thus, the hypothesis that people are
more than 50% correct in their correctness judgments for real words is supported by the
data.