---
title: "PEC1 Otoño 2020"
author: "UOC"
date: ''
output:
pdf_document: default
word_document: default
fontsize: 12pt
---
Las PECs se basarán en una base de datos obtenida a partir del repositorio de microdatos del
“Banco Mundial” en
https://microdata.worldbank.org/index.php/catalog/424/get-microdata
Contiene indicaciones, entre otros de
1. *City* = Nombre de la ciudad
2. *Country* = País
3. *Population2000* = Población de la ciudad en 2000.
4. *PM10Concentration1999* = “PM10 concentrations (micro gramos por cubic meter) in
residential areas of cities larger than 100,000”, en 1999
5. *Region* = Clasificación en región geográfica
6. *IncomeGroup* = Clasificación según nivel de ingresos del país.
Para importar los datos podemos usar la siguiente instrucción:
```{r}
dadesPM10<-read.table("AirPollution2000WB_UOC2.csv", header=TRUE,
sep=";",na.strings="NA",
fileEncoding = "UTF-8", quote = "\"",
colClasses=c(rep("character",4),rep("numeric",2),
rep("character",2)))
, ```
Os puede ser útil consultar el siguiente material:
1. Manuales 1 y 3 de R
2. Actividades Resueltas del Reto 1 (Estadística Descriptiva)
Hay que entregar la práctica en forma de fichero pdf (exportando el resultado final a pdf por
ejemplo) en esta misma tarea Moodle; no hace falta que la entreguéis en el registro de EC.
# NOMBRE: Guillem Grande Pla
# PAC1
Una vez importados los datos
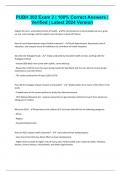
## Pregunta 1. (25%) Encontrad los resúmenes numéricos y un histograma de la variable
PM10Concentration1999 y comentad el resultado.
summary(dadesPM10$PM10Concentration1999)
Min. 1st Qu. Median Mean 3rd Qu. Max.
6.0 24.0 38.0 51.1 71.0 359.0
hist(dadesPM10$PM10Concentration1999)
title: "PEC1 Otoño 2020"
author: "UOC"
date: ''
output:
pdf_document: default
word_document: default
fontsize: 12pt
---
Las PECs se basarán en una base de datos obtenida a partir del repositorio de microdatos del
“Banco Mundial” en
https://microdata.worldbank.org/index.php/catalog/424/get-microdata
Contiene indicaciones, entre otros de
1. *City* = Nombre de la ciudad
2. *Country* = País
3. *Population2000* = Población de la ciudad en 2000.
4. *PM10Concentration1999* = “PM10 concentrations (micro gramos por cubic meter) in
residential areas of cities larger than 100,000”, en 1999
5. *Region* = Clasificación en región geográfica
6. *IncomeGroup* = Clasificación según nivel de ingresos del país.
Para importar los datos podemos usar la siguiente instrucción:
```{r}
dadesPM10<-read.table("AirPollution2000WB_UOC2.csv", header=TRUE,
sep=";",na.strings="NA",
fileEncoding = "UTF-8", quote = "\"",
colClasses=c(rep("character",4),rep("numeric",2),
rep("character",2)))
, ```
Os puede ser útil consultar el siguiente material:
1. Manuales 1 y 3 de R
2. Actividades Resueltas del Reto 1 (Estadística Descriptiva)
Hay que entregar la práctica en forma de fichero pdf (exportando el resultado final a pdf por
ejemplo) en esta misma tarea Moodle; no hace falta que la entreguéis en el registro de EC.
# NOMBRE: Guillem Grande Pla
# PAC1
Una vez importados los datos
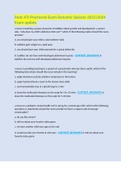
## Pregunta 1. (25%) Encontrad los resúmenes numéricos y un histograma de la variable
PM10Concentration1999 y comentad el resultado.
summary(dadesPM10$PM10Concentration1999)
Min. 1st Qu. Median Mean 3rd Qu. Max.
6.0 24.0 38.0 51.1 71.0 359.0
hist(dadesPM10$PM10Concentration1999)