NEVARR PILLAY
The Performance of the
South African Economy
2011
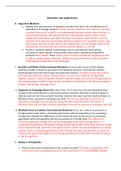
, GDP @ current prices vs GDP @ constant 2005 prices
3000000.0
2500000.0 GDP @ current
prices R million
2000000.0
GDP @ constant
Rand in Millions
2005 prices R
1500000.0 million
Linear (GDP @
1000000.0 current prices R
million)
500000.0 Linear (GDP @
constant 2005
prices R million)
0.0
1979
1981
1983
1985
1987
1989
1991
1993
1995
1997
1999
2001
2003
2005
2007
2009
-500000.0
Years
Comment: Both Graphs are positive. However, the one representing GDP at current prices is growing
at an exponential rate while the other graph is relatively linear and constant. GDP at
constant prices is higher than GDP at current prices as a whole, but when they are
measured against the same price, GDP at current prices becomes the greater figure.
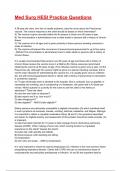
GDP growth vs Disposable income per household growth
8.0
6.0
4.0 GDP growth
Percentage
2.0 Disposable income per household
growth
0.0 Linear (GDP growth )
1979
1981
1983
1985
1987
1989
1991
1993
1995
1997
1999
2001
2003
2005
2007
2009
-2.0
Linear (Disposable income per
household growth)
-4.0
-6.0
Years
Comment: In terms of the shape of the graphs and their trendlines, the graphs are very similar. This
suggests that GDP growth and the growth of disposable income are interlinked and would
be equal if the population of South Africa stayed constant, as disposable income is also
dependant on population growth. Because of the increase of population, on the whole,
GDP growth is greater than disposable income growth.
2|Page
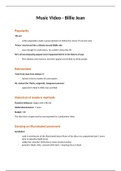
, Government Debt as a % of GDP vs Budget Deficit %
60.0 2.0
1.0
50.0 0.0
-1.0 Government Debt as a % of
40.0
Percentage
Percentage
-2.0 GDP %
30.0 -3.0 Budget deficit %
-4.0
20.0 -5.0 Linear (Government Debt as a
-6.0 % of GDP %)
10.0
-7.0 Linear (Budget deficit %)
0.0 -8.0
2009
1979
1982
1985
1988
1991
1994
1997
2000
2003
Years 2006
Comment: There were two major periods for both Government debt as a percentage of GDP and the
budget deficit, where they followed specific trends. The two periods that I refer to, for
Government debt as a percentage of GDP, are between 1979 and 1994 and between
1995 and 2007. During the first period, the graph gradually increased, showing the
increase of debt in relation to the economic growth of SA and during the second period,
the graph gradually decreased, showing the decrease of debt in relation to the economic
growth of SA. For the budget deficit, the two major periods are between 1991 and 2000
and between 2007 and 2009. During the first period, the Graph dramatically decreased
and then increased which represents an increasing deficit and then a decreasing deficit.
During the second period, the budget deficit percentage dramatically declined which
shows a great increasing of the deficit of the budget.
R/$ rate Cents
1200.0
1000.0
800.0
Rand (Cents)
600.0
R/$ rate Cents
400.0
Linear (R/$ rate Cents)
200.0
0.0
1979
1981
1983
1985
1987
1989
1991
1993
1995
1997
1999
2001
2003
2005
2007
2009
Years
3|Page
The Performance of the
South African Economy
2011
, GDP @ current prices vs GDP @ constant 2005 prices
3000000.0
2500000.0 GDP @ current
prices R million
2000000.0
GDP @ constant
Rand in Millions
2005 prices R
1500000.0 million
Linear (GDP @
1000000.0 current prices R
million)
500000.0 Linear (GDP @
constant 2005
prices R million)
0.0
1979
1981
1983
1985
1987
1989
1991
1993
1995
1997
1999
2001
2003
2005
2007
2009
-500000.0
Years
Comment: Both Graphs are positive. However, the one representing GDP at current prices is growing
at an exponential rate while the other graph is relatively linear and constant. GDP at
constant prices is higher than GDP at current prices as a whole, but when they are
measured against the same price, GDP at current prices becomes the greater figure.
GDP growth vs Disposable income per household growth
8.0
6.0
4.0 GDP growth
Percentage
2.0 Disposable income per household
growth
0.0 Linear (GDP growth )
1979
1981
1983
1985
1987
1989
1991
1993
1995
1997
1999
2001
2003
2005
2007
2009
-2.0
Linear (Disposable income per
household growth)
-4.0
-6.0
Years
Comment: In terms of the shape of the graphs and their trendlines, the graphs are very similar. This
suggests that GDP growth and the growth of disposable income are interlinked and would
be equal if the population of South Africa stayed constant, as disposable income is also
dependant on population growth. Because of the increase of population, on the whole,
GDP growth is greater than disposable income growth.
2|Page
, Government Debt as a % of GDP vs Budget Deficit %
60.0 2.0
1.0
50.0 0.0
-1.0 Government Debt as a % of
40.0
Percentage
Percentage
-2.0 GDP %
30.0 -3.0 Budget deficit %
-4.0
20.0 -5.0 Linear (Government Debt as a
-6.0 % of GDP %)
10.0
-7.0 Linear (Budget deficit %)
0.0 -8.0
2009
1979
1982
1985
1988
1991
1994
1997
2000
2003
Years 2006
Comment: There were two major periods for both Government debt as a percentage of GDP and the
budget deficit, where they followed specific trends. The two periods that I refer to, for
Government debt as a percentage of GDP, are between 1979 and 1994 and between
1995 and 2007. During the first period, the graph gradually increased, showing the
increase of debt in relation to the economic growth of SA and during the second period,
the graph gradually decreased, showing the decrease of debt in relation to the economic
growth of SA. For the budget deficit, the two major periods are between 1991 and 2000
and between 2007 and 2009. During the first period, the Graph dramatically decreased
and then increased which represents an increasing deficit and then a decreasing deficit.
During the second period, the budget deficit percentage dramatically declined which
shows a great increasing of the deficit of the budget.
R/$ rate Cents
1200.0
1000.0
800.0
Rand (Cents)
600.0
R/$ rate Cents
400.0
Linear (R/$ rate Cents)
200.0
0.0
1979
1981
1983
1985
1987
1989
1991
1993
1995
1997
1999
2001
2003
2005
2007
2009
Years
3|Page