Macro-Economics Chapter 28 Page 1 of 11
Expenditure Multipliers
Equilibrium income is attained when aggregate planned expenditure equals income. Equilibrium
expenditure is a level of expenditure and income at which everyone’s spending plans are fulfilled.This implies
that there are no unplanned changes in inventories/stocks. If the aforementioned conditions are not met then
the economy is not at equilibrium and convergence sets in naturally or through some intervention (Govt).
Fixed price and planned
expenditure
In the Keynesian model, all firms set their prices
and sell quantities that their customers are willing
to buy, like a grocery store. If they persistently sell a
greater quantity, they plan to and are constantly
running out f inventory, they will raise their prices.
If they are persistently selling a smaller quantity
than planned, and inventories are pilling up, they
will cut their prices. However, on any given day,
their prices are fixed and the quantities they sell
depend on demand, not supply.
Each firm’s price levels are fixed for the economy as
a whole:
1. The price level is fixed
2. Aggregate demand determines real GDP
Expenditure Plans
Aggregate expenditure components:
1. Consumption expenditure
2. Investment
3. Government expenditure on goods and services
4. Net exports (exports - imports)
AE = C + I + G + (X-M)
Aggregate planned expenditure is = the sum of planned levels of consumption expenditure, investment,
government expenditure on goods and services and exports minus imports. 2 of these components of
planned expenditure, consumption expenditure and imports, change when income changes and depends on
real GDP.
INCREASE IN AE = INCREASE REAL GDP
INCREASE IN REAL GDP = INCREASE IN AE
Consumption And Saving Plans
1. Disposable Income: aggregate income - taxes + transfer payments. Aggregate income = real GDP, so
disposable income depends on real GDP. The relationship between consumption expenditure and
, Macro-Economics Chapter 28 Page 2 of 11
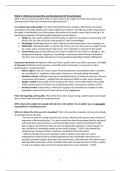
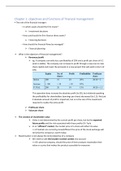
disposable income -> the consumption
Y-axis: consumption expenditure
X-axis: disposable income
When disposable income = 0, this is autonomous
consumption and it is the amount of CE that
would take place in the short run if there was no
current income.
CE in excess= induced consumption, which is
induced by an increase in dispose income.
The 45 degree line, the height measures the
disposable income.
When CE > disposable income, dissaving.
function. Saving + disposable income = the
saving function.
2. Real interest rate
3. Wealth
4. Expected future income
Marginal propensities to consume and save
The MPC is the fraction of change in disposable income that is spent on consumption. It is calculated as the
change in CE/ the change in disposable income.
The MPS is the fraction of change in disposable income that is saved. It is calculated as the change in
saving/ the change in disposable income.
An increase in disposable income is either spent on consumption or saved, the MPC + MPS = 1.
The slope of the consumption function is the marginal propensity to consume and the slop of the saving
function is the marginal propensity to save.
Consumption as a function of real GDP
CE changes when disposable income changes and disable income changes when real GDP changes. So CE
depends on disposable income and real GDP. This link determines the equilibrium expenditure.
Import Function
Real GDP is the main influence on imports in the short run. An increase in real GDP increases the
quantity of South African imports. The relationship between imports and real GDP is determined
by the MPI - marginal propensity to import, which is a fraction of the increase in real GDP that is
spent on imports. It is calculated as the change in imports / the change in real GDP. For example, if
an increase in real GDP of R 1 trillion increase imports by R0,25 trillion, the marginal propensity to
import is 0,25.
Expenditure Multipliers
Equilibrium income is attained when aggregate planned expenditure equals income. Equilibrium
expenditure is a level of expenditure and income at which everyone’s spending plans are fulfilled.This implies
that there are no unplanned changes in inventories/stocks. If the aforementioned conditions are not met then
the economy is not at equilibrium and convergence sets in naturally or through some intervention (Govt).
Fixed price and planned
expenditure
In the Keynesian model, all firms set their prices
and sell quantities that their customers are willing
to buy, like a grocery store. If they persistently sell a
greater quantity, they plan to and are constantly
running out f inventory, they will raise their prices.
If they are persistently selling a smaller quantity
than planned, and inventories are pilling up, they
will cut their prices. However, on any given day,
their prices are fixed and the quantities they sell
depend on demand, not supply.
Each firm’s price levels are fixed for the economy as
a whole:
1. The price level is fixed
2. Aggregate demand determines real GDP
Expenditure Plans
Aggregate expenditure components:
1. Consumption expenditure
2. Investment
3. Government expenditure on goods and services
4. Net exports (exports - imports)
AE = C + I + G + (X-M)
Aggregate planned expenditure is = the sum of planned levels of consumption expenditure, investment,
government expenditure on goods and services and exports minus imports. 2 of these components of
planned expenditure, consumption expenditure and imports, change when income changes and depends on
real GDP.
INCREASE IN AE = INCREASE REAL GDP
INCREASE IN REAL GDP = INCREASE IN AE
Consumption And Saving Plans
1. Disposable Income: aggregate income - taxes + transfer payments. Aggregate income = real GDP, so
disposable income depends on real GDP. The relationship between consumption expenditure and
, Macro-Economics Chapter 28 Page 2 of 11
disposable income -> the consumption
Y-axis: consumption expenditure
X-axis: disposable income
When disposable income = 0, this is autonomous
consumption and it is the amount of CE that
would take place in the short run if there was no
current income.
CE in excess= induced consumption, which is
induced by an increase in dispose income.
The 45 degree line, the height measures the
disposable income.
When CE > disposable income, dissaving.
function. Saving + disposable income = the
saving function.
2. Real interest rate
3. Wealth
4. Expected future income
Marginal propensities to consume and save
The MPC is the fraction of change in disposable income that is spent on consumption. It is calculated as the
change in CE/ the change in disposable income.
The MPS is the fraction of change in disposable income that is saved. It is calculated as the change in
saving/ the change in disposable income.
An increase in disposable income is either spent on consumption or saved, the MPC + MPS = 1.
The slope of the consumption function is the marginal propensity to consume and the slop of the saving
function is the marginal propensity to save.
Consumption as a function of real GDP
CE changes when disposable income changes and disable income changes when real GDP changes. So CE
depends on disposable income and real GDP. This link determines the equilibrium expenditure.
Import Function
Real GDP is the main influence on imports in the short run. An increase in real GDP increases the
quantity of South African imports. The relationship between imports and real GDP is determined
by the MPI - marginal propensity to import, which is a fraction of the increase in real GDP that is
spent on imports. It is calculated as the change in imports / the change in real GDP. For example, if
an increase in real GDP of R 1 trillion increase imports by R0,25 trillion, the marginal propensity to
import is 0,25.