MATH 110 MODULE 8 EXAM QUESTIONS AND
ANSWERS PORTAGE LEARNING
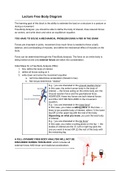
1. . Independent random samples were selected from population 1 and population 2.
The following information was obtained from these samples:
a) Find the 95% confidence interval for estimating the difference in the population means
(µ - µ ).
1 2
Solution. When we look back at table 6.1, we see that 95% confidence corresponds
to z=1.96.
a) Notice that the sample sizes are each greater than 30, so we may use eqn. 8.1:
b) Notice that the 95% confidence interval covers both positive and negative
values. Therefore, we cannot be 95% confident that there is a difference in the two
population means.
2. 2. A company would like to determine if there is a difference in the number of days
that employees are absent from the East Side Plant compared to the West Side Plant. So,
the company takes a sample of 54 employees from the East Side Plant and finds that
these people missed an average of 5.3 days last year with a standard deviation of 1.3
days. A sample of 41 employees from the West Side plant revealed that these people
were absent an average of 6.8 days last year with a standard deviation of 1.8 days.
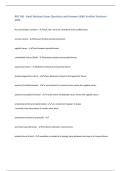
a) Find the 96% confidence interval for estimating the difference in the population means
(µ - µ ).
1 2
Solution. When we look back at table 6.1, we see that 96% confidence corresponds
to z=2.05. If we say that the East Side Plant corresponds to population 1 and the
West Side Plant corresponds to population 2, then:
n =54, n =41, s =1.3, s =1.8, x ぁ = 5.3, x あ = 6.8,
1 2 1 2
a) We will use eqn. 8.1:
urce was downloaded by 100000848594376 from CourseHero.com on 01-16-2023 21:
, b) Notice that the entire 96% confidence interval is negative (it is never positive or
zero). Therefore, we can say that we are 96% confident that there is a difference in
the two population means.
c) Since the entire confidence interval is negative, we can be 96% confident that
(µ1 - µ2) is negative. This means that on average, people from the West Side
Plant will be absent more days than people from the East Side Plant..
3. The mayor of a city would like to know if there is a difference in the systolic blood
pressure of those who live in her city compared to those who live in the rural area
outside the city. So, 77 city dwellers are selected and it is found that their mean systolic
blood pressure is 142 with a standard deviation of 10.7. Also, 65 people are selected
from the surrounding rural area and it is found that their mean systolic blood pressure is
129 with a standard deviation of 8.6.
problems. This is especially important in subjects like proof-based mathematics.Calculation and Accuracy: Mathematical exams test a student’s ability to perform
accurate calculations and apply mathematical principles in the correct sequence to reach a solution.Understanding of Concepts: Beyond solving problems,
mathematics exams test students’ conceptual understanding of core topics, such as algebra, geometry, calc
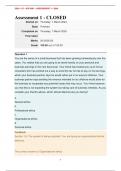
a) Find the 98% confidence interval for estimating the difference in the population means
(µ - µ ).
1 2
Solution. When we look back at table 6.1, we see that 98% confidence corresponds
to z=2.33. If we say that the city residents corresponds to population 1 and the
rural corresponds to population 2, then:
n =77, n =65, s =10.7, s =8.6, x = 142, x = 129
1 2 1 2 1 2
a) We will use eqn. 8.1:
b) Notice that the entire 98% confidence interval is positive (it is never negative or
zero). Therefore, we can say that we are 98% confident that there is a difference in
the two population means.
c) Since the entire confidence interval is positive, we can be 98% confident that
(µ1 - µ2) is positive. This means that on average, people from the city have higher
systolic blood pressure than those from the rural area.
Problem Set 8.2 Solutions
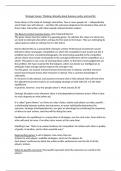
1. Suppose we have independent random samples of size n = 780 and n = 700. The 1 2
number of successes in the two samples were x = 538 and x = 434. Find the 95% 1 2
confidence interval for the difference in the two population proportions. Solution.
From table 6.1, we see that 95% confidence corresponds to z=1.96.
Recall p = x /n = 538/780= .6897 and p = x /n = 434/700= .62.
1 1 1 2 2 2
Notice that the sample sizes are each greater than 30, so we may use eqn. 8.2:
ANSWERS PORTAGE LEARNING
1. . Independent random samples were selected from population 1 and population 2.
The following information was obtained from these samples:
a) Find the 95% confidence interval for estimating the difference in the population means
(µ - µ ).
1 2
Solution. When we look back at table 6.1, we see that 95% confidence corresponds
to z=1.96.
a) Notice that the sample sizes are each greater than 30, so we may use eqn. 8.1:
b) Notice that the 95% confidence interval covers both positive and negative
values. Therefore, we cannot be 95% confident that there is a difference in the two
population means.
2. 2. A company would like to determine if there is a difference in the number of days
that employees are absent from the East Side Plant compared to the West Side Plant. So,
the company takes a sample of 54 employees from the East Side Plant and finds that
these people missed an average of 5.3 days last year with a standard deviation of 1.3
days. A sample of 41 employees from the West Side plant revealed that these people
were absent an average of 6.8 days last year with a standard deviation of 1.8 days.
a) Find the 96% confidence interval for estimating the difference in the population means
(µ - µ ).
1 2
Solution. When we look back at table 6.1, we see that 96% confidence corresponds
to z=2.05. If we say that the East Side Plant corresponds to population 1 and the
West Side Plant corresponds to population 2, then:
n =54, n =41, s =1.3, s =1.8, x ぁ = 5.3, x あ = 6.8,
1 2 1 2
a) We will use eqn. 8.1:
urce was downloaded by 100000848594376 from CourseHero.com on 01-16-2023 21:
, b) Notice that the entire 96% confidence interval is negative (it is never positive or
zero). Therefore, we can say that we are 96% confident that there is a difference in
the two population means.
c) Since the entire confidence interval is negative, we can be 96% confident that
(µ1 - µ2) is negative. This means that on average, people from the West Side
Plant will be absent more days than people from the East Side Plant..
3. The mayor of a city would like to know if there is a difference in the systolic blood
pressure of those who live in her city compared to those who live in the rural area
outside the city. So, 77 city dwellers are selected and it is found that their mean systolic
blood pressure is 142 with a standard deviation of 10.7. Also, 65 people are selected
from the surrounding rural area and it is found that their mean systolic blood pressure is
129 with a standard deviation of 8.6.
problems. This is especially important in subjects like proof-based mathematics.Calculation and Accuracy: Mathematical exams test a student’s ability to perform
accurate calculations and apply mathematical principles in the correct sequence to reach a solution.Understanding of Concepts: Beyond solving problems,
mathematics exams test students’ conceptual understanding of core topics, such as algebra, geometry, calc
a) Find the 98% confidence interval for estimating the difference in the population means
(µ - µ ).
1 2
Solution. When we look back at table 6.1, we see that 98% confidence corresponds
to z=2.33. If we say that the city residents corresponds to population 1 and the
rural corresponds to population 2, then:
n =77, n =65, s =10.7, s =8.6, x = 142, x = 129
1 2 1 2 1 2
a) We will use eqn. 8.1:
b) Notice that the entire 98% confidence interval is positive (it is never negative or
zero). Therefore, we can say that we are 98% confident that there is a difference in
the two population means.
c) Since the entire confidence interval is positive, we can be 98% confident that
(µ1 - µ2) is positive. This means that on average, people from the city have higher
systolic blood pressure than those from the rural area.
Problem Set 8.2 Solutions
1. Suppose we have independent random samples of size n = 780 and n = 700. The 1 2
number of successes in the two samples were x = 538 and x = 434. Find the 95% 1 2
confidence interval for the difference in the two population proportions. Solution.
From table 6.1, we see that 95% confidence corresponds to z=1.96.
Recall p = x /n = 538/780= .6897 and p = x /n = 434/700= .62.
1 1 1 2 2 2
Notice that the sample sizes are each greater than 30, so we may use eqn. 8.2: