paypal / buymeacoffee
Statistics 2
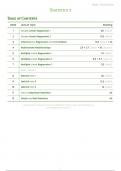
Table of Contents
Week Lecture Topic Reading
1 Simple Linear Regression 1 10.1 (M&M)
2 Simple Linear Regression 2 10.2 (M&M)
3 Inference for Regression and Correlation 10.2 (M&M) + A1
4 Multivariate Relationships 2.5 + 2.7 (M&M) + 10 (Agresti)
5 Multiple Linear Regression 1 11.1 (M&M)
6 Multiple Linear Regression 2 11.6 + 11.7 (Agresti)
7 Multiple Linear Regression 3 11.2 (M&M)
Exam Season
8 ANOVA Part 1 12.1 (M&M)
9 ANOVA Part 2 12.2 (M&M)
10 ANOVA Part 3 13 (M&M)
11 Intro to Bayesian Statistics A2
12 Good and Bad Statistics A3
I appreciate and thank you for any donation; all this money will (probably) go
toward getting uni books :)
1
, paypal / buymeacoffee
Lecture 1 - Simple Linear Regression 1
x variable:
→ explanatory/independent variable
→ continuous or categorical
↳ the values of x define different subpopulations for each x
simple linear regression model
- simple linear regression studies the relationship between a response variable y and a single
explanatory variable x
↳ the mean of y changes as x changes
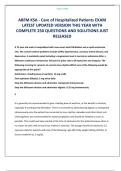
assumption → the observed values of y are Normally
distributed with a mean dependent on x
↳ all means (y) lie on a line when plotted against x
- all y with the same x vary according to N(μ, σ) → σ is the same for all x
µ𝑦 = β0 + β1𝑥
simple regression line
β0 → intercept (y when x = 0)
β1 → slope (the change in y for a one-unit change in x)
population regression line
population regression line → describes how the mean response µ𝑦 changes with 𝑥
↳ goal → estimate β₀ and β₁ from a sample to make predictions and infer the relationship
between x and y in the population
- the statistical model consists of
→ the population regression line:
DATA = FIT + RESIDUAL
FIT → subpopulation means → β0 + β1𝑥
RESIDUAL → deviations from the fit → ε (epsilon)
→ a description of the variation of y about the line:
𝑦𝑖 = β0 + β1𝑥𝑖 + ϵ𝑖
β0 + β1 → mean response when x = x1
εi → independent deviations with N(0, σ)
- linear regression allows us to infer not only about subpopulations for which we have data but
❗caution)
also for x that are not present (
2
, paypal / buymeacoffee
estimating the regression parameters
- we use the least-squares line as a basis for inference about a population from sample data
❗only when the statistical model holds → all assumptions are met
the least-squares formulas (refresh)
- the least-squares line’s model → 𝑦 = 𝑏0 + 𝑏1𝑥
𝑠𝑦
slope → 𝑏1 = 𝑟 𝑠𝑥
intercept → 𝑏0 = 𝑦 − 𝑏1𝑥
𝑠𝑥𝑦 (𝑐𝑜𝑣𝑎𝑟𝑖𝑎𝑛𝑐𝑒)
- “r” is the correlation between y and x correlation coefficient → 𝑟 = 𝑠𝑥𝑠𝑦
1
covariance → 𝑠𝑥𝑦 = 𝑛−1
∑(𝑥𝑖 − 𝑥)(𝑦𝑖 − 𝑦)
predicting parameters
^
- the predicted value of y for any given x* → 𝑦 = 𝑏0 + 𝑏1𝑥 *
residuals → ei = observed response - predicted response
= 𝑦𝑖 − 𝑦𝑖
=𝑦 − 𝑏 − 𝑏 𝑥
𝑖 0 1 𝑖
↳ the residuals ei correspond with the model’s deviation εi so we use them in the model
2
- the model standard deviation σ is given by → 𝑠 = 𝑠
2
2
2 Σ𝑒𝑖 Σ(𝑦𝑖−𝑦𝑖)
𝑠 = 𝑛−2
= 𝑛−2
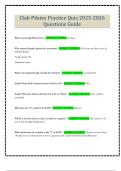
- before using the model, we have to visually check the data to see if the conditions are met
↳ if residuals are (roughly) uniformly spread, we assume a common standard deviation
3
, paypal / buymeacoffee
Lecture 2 - Simple Linear Regression 2
confidence intervals and significance tests
- a level C confidence interval (CI) for β1 is:
𝑏1 ± 𝑡 * 𝑆𝐸𝑏
1
t* → the value for the t(n-2) curve with area C between -t* and t*
- because we don’t know σ, we estimate it by s → we move to a t distribution with n - 2 degrees
of freedom
- to test H0: β1 = 0 (no effect), we compute the test statistic:
𝑏1
𝑡= 𝑆𝐸𝑏
1
↳ H0: β1 = 0 says that linear regression of y on x has no value for predicting y
- a very small P-value doesn’t mean we found a strong relationship, but that the result is
statistically significant → a CI will provide more information
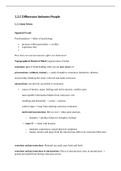
analysis of variance for regression
- ANOVA or Analysis of Variance
↳ statistical method that splits the variation of the data into separate sources:
SSTotal = SSModel + SSError
2
total sum of squares (SST) → Σ(𝑦𝑖 − 𝑦)
↳ variance(y) → SST/n-1
explained part (SSR/SSM) → the variation in y that can be attributed to the linear relationship
with x, captured by the regression model
↳ how well the regression model explains the variation in y
unexplained part (SSE) → observed values vary from the regression line
↳ measures the discrepancies between the observed y (yi) and the predicted y (𝑦𝑖)
2
𝑆𝑆𝑀 = 𝑝𝑟𝑒𝑑𝑖𝑐𝑡𝑒𝑑 − 𝑚𝑒𝑎𝑛 = Σ(𝑦𝑖 − 𝑦𝑖)
2
𝑆𝑆𝐸 = 𝑜𝑏𝑠𝑒𝑟𝑣𝑒𝑑 − 𝑝𝑟𝑒𝑑𝑖𝑐𝑡𝑒𝑑 = Σ(𝑦𝑖 − 𝑦𝑖)
4
Statistics 2
Table of Contents
Week Lecture Topic Reading
1 Simple Linear Regression 1 10.1 (M&M)
2 Simple Linear Regression 2 10.2 (M&M)
3 Inference for Regression and Correlation 10.2 (M&M) + A1
4 Multivariate Relationships 2.5 + 2.7 (M&M) + 10 (Agresti)
5 Multiple Linear Regression 1 11.1 (M&M)
6 Multiple Linear Regression 2 11.6 + 11.7 (Agresti)
7 Multiple Linear Regression 3 11.2 (M&M)
Exam Season
8 ANOVA Part 1 12.1 (M&M)
9 ANOVA Part 2 12.2 (M&M)
10 ANOVA Part 3 13 (M&M)
11 Intro to Bayesian Statistics A2
12 Good and Bad Statistics A3
I appreciate and thank you for any donation; all this money will (probably) go
toward getting uni books :)
1
, paypal / buymeacoffee
Lecture 1 - Simple Linear Regression 1
x variable:
→ explanatory/independent variable
→ continuous or categorical
↳ the values of x define different subpopulations for each x
simple linear regression model
- simple linear regression studies the relationship between a response variable y and a single
explanatory variable x
↳ the mean of y changes as x changes
assumption → the observed values of y are Normally
distributed with a mean dependent on x
↳ all means (y) lie on a line when plotted against x
- all y with the same x vary according to N(μ, σ) → σ is the same for all x
µ𝑦 = β0 + β1𝑥
simple regression line
β0 → intercept (y when x = 0)
β1 → slope (the change in y for a one-unit change in x)
population regression line
population regression line → describes how the mean response µ𝑦 changes with 𝑥
↳ goal → estimate β₀ and β₁ from a sample to make predictions and infer the relationship
between x and y in the population
- the statistical model consists of
→ the population regression line:
DATA = FIT + RESIDUAL
FIT → subpopulation means → β0 + β1𝑥
RESIDUAL → deviations from the fit → ε (epsilon)
→ a description of the variation of y about the line:
𝑦𝑖 = β0 + β1𝑥𝑖 + ϵ𝑖
β0 + β1 → mean response when x = x1
εi → independent deviations with N(0, σ)
- linear regression allows us to infer not only about subpopulations for which we have data but
❗caution)
also for x that are not present (
2
, paypal / buymeacoffee
estimating the regression parameters
- we use the least-squares line as a basis for inference about a population from sample data
❗only when the statistical model holds → all assumptions are met
the least-squares formulas (refresh)
- the least-squares line’s model → 𝑦 = 𝑏0 + 𝑏1𝑥
𝑠𝑦
slope → 𝑏1 = 𝑟 𝑠𝑥
intercept → 𝑏0 = 𝑦 − 𝑏1𝑥
𝑠𝑥𝑦 (𝑐𝑜𝑣𝑎𝑟𝑖𝑎𝑛𝑐𝑒)
- “r” is the correlation between y and x correlation coefficient → 𝑟 = 𝑠𝑥𝑠𝑦
1
covariance → 𝑠𝑥𝑦 = 𝑛−1
∑(𝑥𝑖 − 𝑥)(𝑦𝑖 − 𝑦)
predicting parameters
^
- the predicted value of y for any given x* → 𝑦 = 𝑏0 + 𝑏1𝑥 *
residuals → ei = observed response - predicted response
= 𝑦𝑖 − 𝑦𝑖
=𝑦 − 𝑏 − 𝑏 𝑥
𝑖 0 1 𝑖
↳ the residuals ei correspond with the model’s deviation εi so we use them in the model
2
- the model standard deviation σ is given by → 𝑠 = 𝑠
2
2
2 Σ𝑒𝑖 Σ(𝑦𝑖−𝑦𝑖)
𝑠 = 𝑛−2
= 𝑛−2
- before using the model, we have to visually check the data to see if the conditions are met
↳ if residuals are (roughly) uniformly spread, we assume a common standard deviation
3
, paypal / buymeacoffee
Lecture 2 - Simple Linear Regression 2
confidence intervals and significance tests
- a level C confidence interval (CI) for β1 is:
𝑏1 ± 𝑡 * 𝑆𝐸𝑏
1
t* → the value for the t(n-2) curve with area C between -t* and t*
- because we don’t know σ, we estimate it by s → we move to a t distribution with n - 2 degrees
of freedom
- to test H0: β1 = 0 (no effect), we compute the test statistic:
𝑏1
𝑡= 𝑆𝐸𝑏
1
↳ H0: β1 = 0 says that linear regression of y on x has no value for predicting y
- a very small P-value doesn’t mean we found a strong relationship, but that the result is
statistically significant → a CI will provide more information
analysis of variance for regression
- ANOVA or Analysis of Variance
↳ statistical method that splits the variation of the data into separate sources:
SSTotal = SSModel + SSError
2
total sum of squares (SST) → Σ(𝑦𝑖 − 𝑦)
↳ variance(y) → SST/n-1
explained part (SSR/SSM) → the variation in y that can be attributed to the linear relationship
with x, captured by the regression model
↳ how well the regression model explains the variation in y
unexplained part (SSE) → observed values vary from the regression line
↳ measures the discrepancies between the observed y (yi) and the predicted y (𝑦𝑖)
2
𝑆𝑆𝑀 = 𝑝𝑟𝑒𝑑𝑖𝑐𝑡𝑒𝑑 − 𝑚𝑒𝑎𝑛 = Σ(𝑦𝑖 − 𝑦𝑖)
2
𝑆𝑆𝐸 = 𝑜𝑏𝑠𝑒𝑟𝑣𝑒𝑑 − 𝑝𝑟𝑒𝑑𝑖𝑐𝑡𝑒𝑑 = Σ(𝑦𝑖 − 𝑦𝑖)
4