Lecture 2:
Chapter 8: Inference for Proportions
Important formulas in the Formula sheet p. 3.
We will replace the means with proportions.
8.1 Inference for a Single Proportions (will be same as one sample z - test)
8.2 Comparing 2 Proportions (2 sample z - test)
Statistical Estimation: Try to figure out what will be the color of the sky. There is a range
that I expect them to be. The further away the color will be from that range, the more
surprised I will be.
This is the same with hypothesis testing. There are a range of values that are likely, and that
are unlikely. Based on analyses you can update your belief (hypothesis).
Example:
H0: there is no difference in height between left - handers and right - handers.
H0= M1-M2= 0 (in slides for some reason H0=0).
Recap: we have different types of distributions to test the hypotheses.
Example: Lecturer noticed that his height is smaller than Dutch men’s height. So he wanted
to test the hypothesis:
H0: My height is the same as Dutch men’s height
Which distribution do I use?
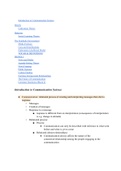
a) Individual Sample Scores (Data of individual heights of Dutch people)--> This
wouldn’t allow you to answer questions about the Dutch population
😀
b) The population Scores? (Distribution of the whole Dutch population) → in practise we
don’t have that value, also inefficient to measure every single person
c) Something else?
→ yes, we can test the scores with less data than population to make an inference about.
1
,→ The distribution of sample means or called Sample Distribution
(we infer the distribution of what would happen if we repeatedly sampled from Dutch
population. Using the hypothetical of many samples, we can test our hypothesis.)
Statistical Estimation:
- N = 16 (16 men were measures)
- Sample mean = 240.70 (cm)
How do we know what the population mean will be, will that be close to the sample mean
value or far?
Assumptions:
- The population is Normal, so is the sampling distribution. It has central tendency,
so we can get close to the tendency by taking a sample.
- Randomly sampled: We have to assume that our process on sampling is random, in
a sense that on average in random sample, we will have the same mean as the
population mean.
(There is no bias in my sample, I am not going to select a set of basketball players
that would distort my average height mean).
We have to make an inference/ guess of what the spread would be of these means.
If my sample is e.g. 16, it is not very reliable, since it is a small sample size. If my size was
like 100, I would me more sure that my sample mean is closer to the population mean.
And the measure we need to quantify is:--> Standard deviation of hypothesized sampling
distribution:
2
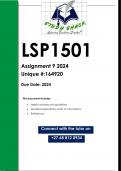
,Spread in this slide is the Standard deviation of the hypothesised sample distribution.
- We take the spread of our sample and divide it by the squared root of the sample
size.
- Let’s visualize this!
The real spread =20.
We draw many samples of 16 from this same population. They all have different values and
form another population (distribution on the right).
Spread = spread of population / Squared N
We will use these values to calculate the p- value and see if we can reject the H0.
How do we find p-value? Use z table and find the probabilities under this distribution.
96%of the data fits into 1.96
standard deviations removed
from the mean.
If the value falls in the tails
(crtitical value)--> reject H0.
3
, Example: if we had to do the estimate, what would be our best guess where the population
mean will fall?
If we want to make an estimate- What would be our best guess where our population value
will fall?
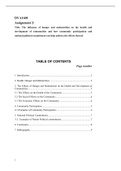
- If we want to be 95% confident of the population value the population mean estimate
might take, we take the range around the mean. This mean will be exactly the range
that contains 95% of the normal distribution.
- In our case we calculated that if we have a population spread = 20, then our sample
spread is =5.
So if we are 2 standard deviations from the mean , that would be 10 from the mean.
Thus our range of likely population mean would be Sampling distribution mean +- 10.
That would be the range that contains 95% of the samples of this process of random
sampling (??)
This is the theory behind how we
create confidence interval values.
4
Chapter 8: Inference for Proportions
Important formulas in the Formula sheet p. 3.
We will replace the means with proportions.
8.1 Inference for a Single Proportions (will be same as one sample z - test)
8.2 Comparing 2 Proportions (2 sample z - test)
Statistical Estimation: Try to figure out what will be the color of the sky. There is a range
that I expect them to be. The further away the color will be from that range, the more
surprised I will be.
This is the same with hypothesis testing. There are a range of values that are likely, and that
are unlikely. Based on analyses you can update your belief (hypothesis).
Example:
H0: there is no difference in height between left - handers and right - handers.
H0= M1-M2= 0 (in slides for some reason H0=0).
Recap: we have different types of distributions to test the hypotheses.
Example: Lecturer noticed that his height is smaller than Dutch men’s height. So he wanted
to test the hypothesis:
H0: My height is the same as Dutch men’s height
Which distribution do I use?
a) Individual Sample Scores (Data of individual heights of Dutch people)--> This
wouldn’t allow you to answer questions about the Dutch population
😀
b) The population Scores? (Distribution of the whole Dutch population) → in practise we
don’t have that value, also inefficient to measure every single person
c) Something else?
→ yes, we can test the scores with less data than population to make an inference about.
1
,→ The distribution of sample means or called Sample Distribution
(we infer the distribution of what would happen if we repeatedly sampled from Dutch
population. Using the hypothetical of many samples, we can test our hypothesis.)
Statistical Estimation:
- N = 16 (16 men were measures)
- Sample mean = 240.70 (cm)
How do we know what the population mean will be, will that be close to the sample mean
value or far?
Assumptions:
- The population is Normal, so is the sampling distribution. It has central tendency,
so we can get close to the tendency by taking a sample.
- Randomly sampled: We have to assume that our process on sampling is random, in
a sense that on average in random sample, we will have the same mean as the
population mean.
(There is no bias in my sample, I am not going to select a set of basketball players
that would distort my average height mean).
We have to make an inference/ guess of what the spread would be of these means.
If my sample is e.g. 16, it is not very reliable, since it is a small sample size. If my size was
like 100, I would me more sure that my sample mean is closer to the population mean.
And the measure we need to quantify is:--> Standard deviation of hypothesized sampling
distribution:
2
,Spread in this slide is the Standard deviation of the hypothesised sample distribution.
- We take the spread of our sample and divide it by the squared root of the sample
size.
- Let’s visualize this!
The real spread =20.
We draw many samples of 16 from this same population. They all have different values and
form another population (distribution on the right).
Spread = spread of population / Squared N
We will use these values to calculate the p- value and see if we can reject the H0.
How do we find p-value? Use z table and find the probabilities under this distribution.
96%of the data fits into 1.96
standard deviations removed
from the mean.
If the value falls in the tails
(crtitical value)--> reject H0.
3
, Example: if we had to do the estimate, what would be our best guess where the population
mean will fall?
If we want to make an estimate- What would be our best guess where our population value
will fall?
- If we want to be 95% confident of the population value the population mean estimate
might take, we take the range around the mean. This mean will be exactly the range
that contains 95% of the normal distribution.
- In our case we calculated that if we have a population spread = 20, then our sample
spread is =5.
So if we are 2 standard deviations from the mean , that would be 10 from the mean.
Thus our range of likely population mean would be Sampling distribution mean +- 10.
That would be the range that contains 95% of the samples of this process of random
sampling (??)
This is the theory behind how we
create confidence interval values.
4