Statistics for Pre-MSc SCM & TOM – Knowledge clips summary
Book: statistics for business and economics, fifth edition, ISBN: 9781473768451
Clip 1: the role of statistics and data -> chapter 1
- Statistics is the art and science of collecting, analyzing, presenting and
interpreting data.
It provides information for decision making.
- Databases = can be used for statistical analysis
- All information in these databases provide an overview of multiple aspects.
It can be used to find out drivers of product sales for example.
- Big data = everything is stored on servers (information, personal info etc)
- Data sciences helps to support decisions based on calculations.
Nowadays big data is valuable information for finding out relevant things to
investigate into detail -> the behavior of customer can be examined.
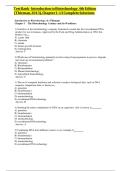
Terminology in statistics:
- Database / data set = total number of information / numbers in a sheet
- Columns = variables -> vertical axis
- Rows = observations / cases -> horizontal axis
- Each cell = measurement / data point
Types of variables: level of measurement
- Ratio = the same as interval but true zero exist (0 years old)
- Interval = the difference between the skills is the same (10-20 degrees is the
same difference as 30-40 degrees)
- Ordinal = a category with an order (sport competition; 1 st, 2nd, 3th)
- Nominal = a label, description, a category
Ration and interval = metric / numerical data
Ordinal and nominal = categorical data
, - Important consequences for what you can do statistically / mathematically with
the variable
From nominal to ratio = data becomes more powerful, less restrictive
Examples with data:
- Nominal = data can be male or female -> no average can be found
- Ordinal = data can be unsatisfied, neutral, or satisfied (ranking) -> no
differences between variables can be derived
- Interval = differences in data can be drawn, but no true zero -> 15 degrees is
not half of 30 degrees, it is incorrect, and thus can’t be said
- Ratio = differences between data can be drawn -> someone who is 40 is twice
the age of someone who is 20
Types of data sets
- Cross sectional data = sample of individuals, during a time period
Survey of cases (among customers for example)
- Time series data = mostly used in finance -> variables measured over time
The change of stock prices over a long period of time
- Panel data = combination of both -> multiple cases and same variables
measured at multiple time points
Every year you send out the same survey at the same time -> makes it
possible to see differences during a time period (purchase behavior)
It is popular for marketing = data can be used to see how people react to
price changes and how their purchase behavior will be affected
Sources of data:
, - Primary data = data is collected during a survey for example -> high level of
control -> what variables, what people to interview
- Secondary data = information that is already acquired based on running their
business, mostly automatic -> can be used for a different purpose (less
control)
Both data can be combined to get a better understanding of the data =
secondary data can be enriched with collection of primary data that
matches the secondary data
Statistics is a way to get information from data:
- Some questions = What is the average time between purchases of customers,
what is the average leadtime of goods?
- Data is used in statistics to make a conclusion.
- Data is based on a sample; you want to draw a conclusion on a population.
Key statistical concepts:
- Population = a population is the group of all items/ cases of interest
, One wants to draw conclusions on this group.
- Sample = a sample is group of items/ cases drawn from the population
One applies statistical analysis on the data from a sample.
When you can’t study the whole population, you do it based on a sample
within that population to draw a conclusion on that population -> the larger
the sample size the higher the accuracy
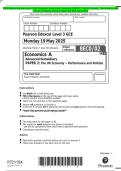
From a population a random sample is drawn -> variable (e.g. money) will be
measured and histogram can be made -> standard deviation (SD) and average can
be computed -> it can be put into a distribution graph with the mean and SD -> based
on the graph something can be said about the population
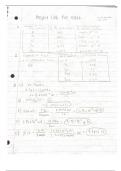
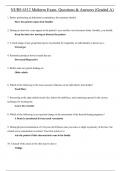
Statistics & the empirical cycle -> used in sciences
- Theory = in sciences theories about the
behavior of consumers are proposed
- Hypothesis = propose a hypothesis: e.g.
if prices go down, sales go up
- Observations = data collection is
needed to get observations
- Empirical findings = test your findings
and make theory based on the data
This circle is used to test theories
and propose new theories
Clip 2: tables and figures -> chapter 2
Statistical methods
Book: statistics for business and economics, fifth edition, ISBN: 9781473768451
Clip 1: the role of statistics and data -> chapter 1
- Statistics is the art and science of collecting, analyzing, presenting and
interpreting data.
It provides information for decision making.
- Databases = can be used for statistical analysis
- All information in these databases provide an overview of multiple aspects.
It can be used to find out drivers of product sales for example.
- Big data = everything is stored on servers (information, personal info etc)
- Data sciences helps to support decisions based on calculations.
Nowadays big data is valuable information for finding out relevant things to
investigate into detail -> the behavior of customer can be examined.
Terminology in statistics:
- Database / data set = total number of information / numbers in a sheet
- Columns = variables -> vertical axis
- Rows = observations / cases -> horizontal axis
- Each cell = measurement / data point
Types of variables: level of measurement
- Ratio = the same as interval but true zero exist (0 years old)
- Interval = the difference between the skills is the same (10-20 degrees is the
same difference as 30-40 degrees)
- Ordinal = a category with an order (sport competition; 1 st, 2nd, 3th)
- Nominal = a label, description, a category
Ration and interval = metric / numerical data
Ordinal and nominal = categorical data
, - Important consequences for what you can do statistically / mathematically with
the variable
From nominal to ratio = data becomes more powerful, less restrictive
Examples with data:
- Nominal = data can be male or female -> no average can be found
- Ordinal = data can be unsatisfied, neutral, or satisfied (ranking) -> no
differences between variables can be derived
- Interval = differences in data can be drawn, but no true zero -> 15 degrees is
not half of 30 degrees, it is incorrect, and thus can’t be said
- Ratio = differences between data can be drawn -> someone who is 40 is twice
the age of someone who is 20
Types of data sets
- Cross sectional data = sample of individuals, during a time period
Survey of cases (among customers for example)
- Time series data = mostly used in finance -> variables measured over time
The change of stock prices over a long period of time
- Panel data = combination of both -> multiple cases and same variables
measured at multiple time points
Every year you send out the same survey at the same time -> makes it
possible to see differences during a time period (purchase behavior)
It is popular for marketing = data can be used to see how people react to
price changes and how their purchase behavior will be affected
Sources of data:
, - Primary data = data is collected during a survey for example -> high level of
control -> what variables, what people to interview
- Secondary data = information that is already acquired based on running their
business, mostly automatic -> can be used for a different purpose (less
control)
Both data can be combined to get a better understanding of the data =
secondary data can be enriched with collection of primary data that
matches the secondary data
Statistics is a way to get information from data:
- Some questions = What is the average time between purchases of customers,
what is the average leadtime of goods?
- Data is used in statistics to make a conclusion.
- Data is based on a sample; you want to draw a conclusion on a population.
Key statistical concepts:
- Population = a population is the group of all items/ cases of interest
, One wants to draw conclusions on this group.
- Sample = a sample is group of items/ cases drawn from the population
One applies statistical analysis on the data from a sample.
When you can’t study the whole population, you do it based on a sample
within that population to draw a conclusion on that population -> the larger
the sample size the higher the accuracy
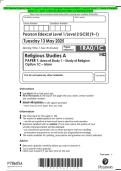
From a population a random sample is drawn -> variable (e.g. money) will be
measured and histogram can be made -> standard deviation (SD) and average can
be computed -> it can be put into a distribution graph with the mean and SD -> based
on the graph something can be said about the population
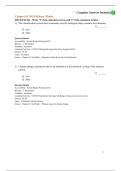
Statistics & the empirical cycle -> used in sciences
- Theory = in sciences theories about the
behavior of consumers are proposed
- Hypothesis = propose a hypothesis: e.g.
if prices go down, sales go up
- Observations = data collection is
needed to get observations
- Empirical findings = test your findings
and make theory based on the data
This circle is used to test theories
and propose new theories
Clip 2: tables and figures -> chapter 2
Statistical methods