INTRODUCTION TO DATA SCIENCE
Paper 2: Data Life Cycle (CRISP-DM)
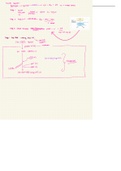
CRISP-DM stands for cross-industry process for data mining. It provides a structured
approach to planning a data mining project. The model is a sequence of events, it has 6
phases:
1. Business understanding:
2. Data understanding
3. Data preparation
4. Modelling
5. Evaluation
6. Deployment
STAGE 1: BUSINESS UNDERSTANDING
understand what you want to accomplish from a business perspective
What are the desired outputs of the project?
Assess the current situation:
o List all resources like personnel, data, computing resources, software.
o List all requirements, assumptions, and constraints.
o List all risks or events that might delay the project or cause it to fail
o Compile a glossary of terminology relevant to the project.
o Construct a cost-benefit analysis for the project which compares the costs of
the project with the potential benefits to the business if it is successful.
Determine data mining goals:
o Business success criteria: describe the intended outputs of the project that
enable the achievement of the business objectives.
o Data mining success criteria: define the criteria for a successful outcome to the
project in technical terms
Produce project plan:
o Project plan: list the stages to be executed in the project, together with their
duration, resources required, inputs, outputs, and dependencies.
o Initial assessment of tools and techniques
STAGE 2: DATA UNDERSTANDING
Acquire the data listed in the project resources
Collect the data: sources and methods
Describe the data: including its format, quantity, identities of the fields
Explore the data: visualize the data by looking at relationships between attributes,
distribution of attributes, and simple statistical analyses.
Verify data quality: is it complete and correct, are there errors or missing values?
,STAGE 3: DATA PREPARATION
Select your data: decide on the data that you are going to use for analysis.
Clean your data: raise the data quality to the level required by the analysis
techniques that you have selected, by for example selecting clean subsets of data /
handling missing data.
Construct required data: derive new attributes / generate records (completely new)
Integrate data: merge and aggregate data
STAGE 4: MODELLING
Select modeling technique: together with any modelling assumptions.
Set up test and training sets
Build the model: list the parameter settings, the models produced and the model
descriptions.
Assess the model: discuss results with experts (considering project goal) and revise
parameter settings: tune them for the next modelling run.
Iterate model building and assessment until you strongly believe that you have found the
best model.
STAGE 5: EVALUATION
Evaluate your results: judge quality of model by taking business criteria into account
and approve the proper models
Review process: check if approved model fulfils and satisfies tasks & requirements
Determine next steps: list the possible actions and decide what to do.
Paper 3: Principles of Data Wrangling
Structure of a dataset refers to the format and encoding of its records and fields.
You want a rectangular dataset: table with a fixed number of rows and columns.
If the record fields in a dataset are not consistent (some records have additional
fields, others are missing fields), then you have a jagged table.
The encoding of the dataset specifies how the record fields are stored and presented
to the user, like what time zones are used for times.
In many cases, it is advisable to encode a dataset in plain text, such that it is human-
readable. Drawback: takes up a lot of space.
More efficient is to use binary encodings of numerical values.
Finding out the structure is mostly about counting the number of records and fields
in the dataset and determining the dataset’s encoding.
A few extra questions to ask yourself when assessing the structure of a dataset:
o Do all records in the dataset contain the same fields?
o How are the records delimited in the dataset?
o What are the relationship types between records and the record fields?
Granularity of a dataset refers to the kinds of entities that each data record represents or
contains information about.
In their most common form, records in a dataset will contain information about
many instances of the same kind of entity (like a costumer ID).
, We look at granularity in terms of coarseness and fineness: the level of depth or the
number of distinct entities represented by a single record of your dataset.
Fine: single record represents a single entity (single transaction at store)
Coarse: single record represents multiple entities (sales per week per region)
A few questions to ask yourself when assessing the data granularity:
o What kind of things do the records represent? (Person, object, event, etc.)
o What alternative interpretations of the records are there?
If the records are customers, could they actually be all known
contacts (only some of which are customers)?
o Example: one dataset has as location the country, the other dataset has
coordinates
Accuracy of a dataset refers to its quality: the values populating record fields in the dataset
should be consistent and accurate.
Common inaccuracies are misspellings of categorical variables, lack of appropriate
categories, underflow and overflow of numerical values, missing field components
A few questions to ask yourself when assessing the data accuracy:
o Check if the date times are specific, are the address components consistent,
and correct, are numeric items like phone numbers complete?
o Is data entered by people? Because that increases the chance of misspellings.
o Does the distribution of inaccuracies affect many records?
Temporality deals with how accurate and consistent the data is over time.
Even when time is not explicitly represented in a dataset, it is still important to
understand how time may have impacted the records in a dataset.
Therefore, it is important to know when the dataset was generated.
A few questions to ask yourself when assessing the data temporality:
o Were all the records and record fields collected at the same time?
o Have some records or record fields been modified after the time of creation?
o In what ways can you determine if the data is stale?
o Can you forecast when the values in the dataset might get stale?
Scope of a dataset has 2 dimensions:
1) The number of distinct attributes represented in a dataset.
2) The attribute-by-attribute population coverage: are all the attributes for each field
represented in the dataset, or have some been randomly, intentionally, or
systematically been excluded.
The larger the scope, the larger the number of fields.
As with granularity, you want to include only as much detail as you might use.
A few questions to ask yourself when assessing the scope of your data:
o Given the granularity, what characteristics of the things represented by the
records are captured by the record fields? And what characteristics are not?
o Are the record fields consistent? Like does the customer’s age field make
sense relative to the date-of-birth field?
o Are the same record fields available for all records?
o Are there multiple records for the same thing? If so, does this change
granularity?
Paper 2: Data Life Cycle (CRISP-DM)
CRISP-DM stands for cross-industry process for data mining. It provides a structured
approach to planning a data mining project. The model is a sequence of events, it has 6
phases:
1. Business understanding:
2. Data understanding
3. Data preparation
4. Modelling
5. Evaluation
6. Deployment
STAGE 1: BUSINESS UNDERSTANDING
understand what you want to accomplish from a business perspective
What are the desired outputs of the project?
Assess the current situation:
o List all resources like personnel, data, computing resources, software.
o List all requirements, assumptions, and constraints.
o List all risks or events that might delay the project or cause it to fail
o Compile a glossary of terminology relevant to the project.
o Construct a cost-benefit analysis for the project which compares the costs of
the project with the potential benefits to the business if it is successful.
Determine data mining goals:
o Business success criteria: describe the intended outputs of the project that
enable the achievement of the business objectives.
o Data mining success criteria: define the criteria for a successful outcome to the
project in technical terms
Produce project plan:
o Project plan: list the stages to be executed in the project, together with their
duration, resources required, inputs, outputs, and dependencies.
o Initial assessment of tools and techniques
STAGE 2: DATA UNDERSTANDING
Acquire the data listed in the project resources
Collect the data: sources and methods
Describe the data: including its format, quantity, identities of the fields
Explore the data: visualize the data by looking at relationships between attributes,
distribution of attributes, and simple statistical analyses.
Verify data quality: is it complete and correct, are there errors or missing values?
,STAGE 3: DATA PREPARATION
Select your data: decide on the data that you are going to use for analysis.
Clean your data: raise the data quality to the level required by the analysis
techniques that you have selected, by for example selecting clean subsets of data /
handling missing data.
Construct required data: derive new attributes / generate records (completely new)
Integrate data: merge and aggregate data
STAGE 4: MODELLING
Select modeling technique: together with any modelling assumptions.
Set up test and training sets
Build the model: list the parameter settings, the models produced and the model
descriptions.
Assess the model: discuss results with experts (considering project goal) and revise
parameter settings: tune them for the next modelling run.
Iterate model building and assessment until you strongly believe that you have found the
best model.
STAGE 5: EVALUATION
Evaluate your results: judge quality of model by taking business criteria into account
and approve the proper models
Review process: check if approved model fulfils and satisfies tasks & requirements
Determine next steps: list the possible actions and decide what to do.
Paper 3: Principles of Data Wrangling
Structure of a dataset refers to the format and encoding of its records and fields.
You want a rectangular dataset: table with a fixed number of rows and columns.
If the record fields in a dataset are not consistent (some records have additional
fields, others are missing fields), then you have a jagged table.
The encoding of the dataset specifies how the record fields are stored and presented
to the user, like what time zones are used for times.
In many cases, it is advisable to encode a dataset in plain text, such that it is human-
readable. Drawback: takes up a lot of space.
More efficient is to use binary encodings of numerical values.
Finding out the structure is mostly about counting the number of records and fields
in the dataset and determining the dataset’s encoding.
A few extra questions to ask yourself when assessing the structure of a dataset:
o Do all records in the dataset contain the same fields?
o How are the records delimited in the dataset?
o What are the relationship types between records and the record fields?
Granularity of a dataset refers to the kinds of entities that each data record represents or
contains information about.
In their most common form, records in a dataset will contain information about
many instances of the same kind of entity (like a costumer ID).
, We look at granularity in terms of coarseness and fineness: the level of depth or the
number of distinct entities represented by a single record of your dataset.
Fine: single record represents a single entity (single transaction at store)
Coarse: single record represents multiple entities (sales per week per region)
A few questions to ask yourself when assessing the data granularity:
o What kind of things do the records represent? (Person, object, event, etc.)
o What alternative interpretations of the records are there?
If the records are customers, could they actually be all known
contacts (only some of which are customers)?
o Example: one dataset has as location the country, the other dataset has
coordinates
Accuracy of a dataset refers to its quality: the values populating record fields in the dataset
should be consistent and accurate.
Common inaccuracies are misspellings of categorical variables, lack of appropriate
categories, underflow and overflow of numerical values, missing field components
A few questions to ask yourself when assessing the data accuracy:
o Check if the date times are specific, are the address components consistent,
and correct, are numeric items like phone numbers complete?
o Is data entered by people? Because that increases the chance of misspellings.
o Does the distribution of inaccuracies affect many records?
Temporality deals with how accurate and consistent the data is over time.
Even when time is not explicitly represented in a dataset, it is still important to
understand how time may have impacted the records in a dataset.
Therefore, it is important to know when the dataset was generated.
A few questions to ask yourself when assessing the data temporality:
o Were all the records and record fields collected at the same time?
o Have some records or record fields been modified after the time of creation?
o In what ways can you determine if the data is stale?
o Can you forecast when the values in the dataset might get stale?
Scope of a dataset has 2 dimensions:
1) The number of distinct attributes represented in a dataset.
2) The attribute-by-attribute population coverage: are all the attributes for each field
represented in the dataset, or have some been randomly, intentionally, or
systematically been excluded.
The larger the scope, the larger the number of fields.
As with granularity, you want to include only as much detail as you might use.
A few questions to ask yourself when assessing the scope of your data:
o Given the granularity, what characteristics of the things represented by the
records are captured by the record fields? And what characteristics are not?
o Are the record fields consistent? Like does the customer’s age field make
sense relative to the date-of-birth field?
o Are the same record fields available for all records?
o Are there multiple records for the same thing? If so, does this change
granularity?