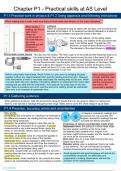
Chapter P1 - Practical skills at AS Level
P1.1 Practical work in physics & P1.2 Using apparaus and following instructions
When reading from a scale, make sure that you know what each division on the scale represents.
When taking a Calipers
reading, the line of These are designed to grip an object with two jaws, and to measure the
sight should diameter of the object, or to measure the internal diameter of a tube by
always be placing the two prongs to just grip the inside of the tube.
perpendicular to This is a dial calipers. As the siding scales
the scale that you moves along, one rotation of the dial moves the
are using, jaws 1 mm further apart. The dial has 100
otherwise you will divisions, so each of these division is 0.01 mm.
introduce a The diameter of the object shown is 12.25 mm.
parallax error.
Micrometer screw gauge This also has two scales. The main scale is on the shaft and the fractional scale is on
the rotating barrel. One rotation of the barrel moves the end of the barrel 0.05 mm
along the shaft. The barrel has 50 divisions so each division represents 0.01 mm.
To use the micrometer, turn the barrel until the jaws just tighten on the object. Read
the main scale to the nearest 0.5 mm, then read the number of divisions on the
sleeve, which will be in 0.01 mm, and finally add the two readings. The smallest
division on the micrometer is 0.01 mm.
Before using these instruments, check if there is a zero error by bringing the jaws When building parallel
together without any object between them and the reading should be zero. However, circuits, build the main
if the instruments is worn or has been used badly the reading may not be zero. When circuit first, and then
you have taken this zero reading, it should be added to or subtracted from every other add the components
reading that you take with the instrument. If the jaws do not quite close to the zero that need to be
mark, there is a positive zero error, and this zero error reading should be subtracted . connected in parallel.
Zero error is an example of systematic error.
P1.3 Gathering evidence
When gathering evidence, take into account the range of results that you are going to obtain by making sure
there is a fair spread of readings throughout that range. Make sure to cover the whole range in equal steps.
P1.4 Precision, accuracy, errors and uncertainties
Key words: LH diagram represents readings that
Uncertainty: the uncertainty in a reading is an estimate of are precise but not accurate, RH
the difference between the reading and true value of the diagram represents readings that are
quantity being measured accurate but without precision.
Precision: the smallest change in value that can be Examples of where uncertainties might arise:
measured by an instrument or an operator. A precise Systematic error: the spring on a force meter might
measurement is one made several times, giving the become weaker overtime so the force reads
same, or very similar, values; there is very little spread consistently high, parallax error, magnet in an
about the mean value ammeter might become weaker and the needle may
Accuracy: an accurate value of a measured quantity is not move as far round the scale
one that is close to the true value of the quantity Zero error: zero on a ruler might not be at the very
Systematic error: causes readings to differ from the true beginning of the ruler
value by a consistent amount each time the reading is Random errors: when a judgement has to be made
made; can be corrected by recalibrating the instrument or by the observer. This can be reduced by making
by correcting the technique being used multiple measurements and averaging the results
Zero error: caused when an instrument gives a non-zero
reading when the true value of the quantity is zero; type of Good equipment and good technique will reduce the
systematic error uncertainties introduced, but difficulties and
Random errors: cause readings to vary around the mean judgements in making observations will limit the
value in an unpredictable way from one reading to another precision of the measurements.
, Chapter P1 - Practical skills at AS Level
P1.5 Finding the value of an uncertainty
The uncertainty can be estimated in two ways: You can find the uncertainty from
Using the division on the scale - Look at the smallest division whichever is the largest out of:
on the scale used for the reading and then decide whether you • the smallest division on the instrument
can read the scale to better than this smallest division. In general, used, or
the position of a mark on a ruler can generally be measured to an • half the range of a number of readings
uncertainty of ± 0.5 mm. of the measurement
Repeating the readings - Repeat the readings several times and
the uncertainty can be taken as half of the range of the values
obtained. This method deals with random errors made in the The uncertainty in using a stopwatch is
readings but does not account for systematic errors. This method likely to be at least 0.1 s if you do not
should always be tried, wherever possible, because it may reveal repeat the reading due to your own
random errors and gives an easy way to estimate the uncertainty. reaction time.
However, if the repeated readings are all the same, the
uncertainty is not zero. The uncertainty can never be less than the The uncertainty is likely to be given to only
value you obtained by looking at the smallest scale division. 1 s.f.
P1.6 Percentage uncertainty
The percentage uncertainty expresses the absolute uncertainty
uncertainty as a fraction of the measured value. percentage uncertainty = x 100%
measured value
E.g., a student times a single swing of a pendulum. The measured time
is 1.4 s and the estimated uncertainty is 0.2 s.
The absolute uncertainty has
uncertainty 0.2 a unit whereas the percentage
percentage uncertainty = x 100% = x 100% = 14% uncertainty is a fraction,
measured value 1.4 shown with a % sign.
• with absolute uncertainty: time for a single swing = 1.4 s ± 0.2 s
• with percentage uncertainty: time for a single swing = 1.4 s ± 14%
P1.7 Recording results
Each column of a table must be labelled with a quantity / unit, and, if a reading be given to the precision of the
instrument, usually to the same number of decimal places. Calculated quantities may have one more
significant figure than the readings used.
P1.8 Analysing results
Key words:
If all points, except one, lie on the line of
Independent variable: the one that the experiment alters or selects
best fit, this point is referred to as an
Dependent variable: the quantity that changes as a result of the
anomalous point, and it should be
independent variable being altered by the experimenter
checked. If it still appears to be off the line
Best fit line: straight line drawn as closely as possible to the points of
it might be best to ignore it and use the
a graph so that similar numbers of points lie above and below the line
remaining points to give the best line. It is
When plotting a graph… best to mark clearly as ‘anomalous’.
• IV is plotted on the x-axis and the DV is plotted on the y-axis.
• Label axes with both the quantities you are using and their units.
• Choose scales that use as much of the graph paper as possible.
• Stick to scales that are simple multiples of 1, 2, or 5.
• Plot points carefully with small crosses.
, Chapter P1 - Practical skills at AS Level
P1.8 Analysing results
Deductions from graphs Curves and tangent
change in y Δy
gradient = =
change in x Δx
P1.9 Testing a relationship
If two quantities y and x are directly proportional: If two quantities y and x are inversely proportional:
• the formula that relates them is y=kx, where k is • the formula that relates them is y=k/x, where k is a
a constant constant
• if a graph is plotted of y against x then the graph • if a graph is plotted of y against 1/x then the graph is
is a straight line through the origin and the a straight line through the origin and the gradient is
gradient is the value of k the value of k
• Write down a criterion.
• Calculate the percentage difference between
two values of the constant.
• Compare the percentage difference with the
percentage uncertainty in one of the variables.
• Write a conclusion as to whether the criterion
is obeyed or not.
Criterion 1
If the percentage difference in k values is less than
the percentage uncertainty in x or y (which ever is
bigger), the readings are consistent with the
relationship.
Criterion 2
The k values should be the same within 10% or
20%, depending on the experiment and the
uncertainty that you think sensible.
Procedure to check whether two values of k are
reasonably constant:
• Calculate two values of the constant k
• Calculate the percentage difference in the two The number of s.f. chosen when writing down the values of
calculated values of k k should be equal to the least number of significant figures
• Compare the percentage difference in the two in the data used. Sometimes, it is worthwhile using one
values of k with your clearly stated criterion more s.f. in each actual value of k than is completely
justified in this calculation.
, Chapter P1 - Practical skills at AS Level
P1.10 Combining uncertainties
• If quantities are added or subtracted,
add absolute uncertainties.
• If quantities are multiplied or divided,
add percentage uncertainties.
You always add uncertainties; never subtract.
P1.11 Identifying limitations in procedures and suggesting improvements
Key words: Experiment 1: Ball-bearings and craters
Problem: a difficulty you experience during the experiment
Improvement: a suggestion that will reduce the problem
Experiment 2: Timing with a stopwatch
Experiment 3: Timing oscillations
Experiment 5: Electrical measurements
Experiment 4: Using force meters