Grade 11 Trigonometric Functions
Document 1: Revision of Grade 10 content
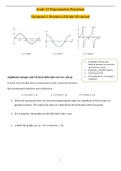
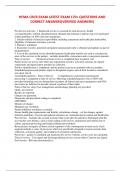
𝑦 = sin 𝑥 𝑦 = cos 𝑥 𝑦 = tan 𝑥
1. Amplitude: Half the total
distance between the minimum
and maximum values.
2. Amplitude is ALWAYS positive
𝑚𝑎𝑥𝑖𝑚𝑢𝑚−𝑚𝑖𝑛𝑖𝑚𝑢𝑚
3.
2
Amplitude changes and Vertical shifts (the role of 𝒂 and 𝒒) 4. The amplitude for a tan graph is
undefined.
In Grade 10 we studied some transformations of the 3 basic trig functions.
Our transformed functions were defined as:
𝑦 = 𝑎 sin 𝑥 + 𝑞 𝑦 = 𝑎 cos 𝑥 + 𝑞 𝑦 = 𝑎 tan 𝑥 + 𝑞
When the numerical value of 𝑎 increases (ignoring the sign), the amplitude of the sin and cos
graphs increases. The numerical value of 𝑎 determines the steepness of the tan graph.
If 𝑎 is negative, the graphs are all reflected in the 𝑥 axis.
𝑞 shifts the graphs up (𝑞 > 0) or down (𝑞 < 0).
1
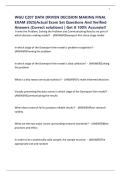
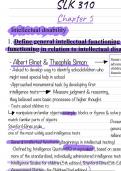
, Worked Example 1: Consider the function 𝑓(𝑥) = 2𝑠𝑖𝑛𝑥 − 1
1. Sketch the graph of 𝑓 for 𝑥 ∈ [0°; 360°].
2. Write down the period and amplitude of 𝑓.
3. Write down the range of 𝑓.
Solution
Thought process:
1. Step 1: Consider the basic shape (sin, cos or tan) Step 2: Consider the stretch (a value)
Start with a basic sin graph, rough sketch 𝑎 = 2. Stretch the graph vertically up to
2 and down to -2.
Step 3: Consider the vertical shift (q value)
𝑞 = −1. The graph is shifted 1 unit down. Think of the 5 critical points (the 3 zeros, the max
and the min) moved down 1 unit each and then joined to give the new sin graph.
NOTE: You may be asked to label all
Turning points and/or ‘end’ points, so you
would label (90°; 1); (270°; −3);
(360° ; −1)
2. Period: 360°
Amplitude: 2
The range is represented by
3. Range: 0 ≤ 𝑦 ≤ −3 or 𝑦 ∈ [−3; 1] 𝑦 ∈ [𝑚𝑖𝑛; 𝑚𝑎𝑥]
2
Document 1: Revision of Grade 10 content
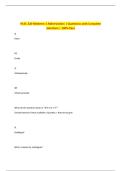
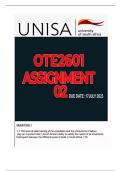
𝑦 = sin 𝑥 𝑦 = cos 𝑥 𝑦 = tan 𝑥
1. Amplitude: Half the total
distance between the minimum
and maximum values.
2. Amplitude is ALWAYS positive
𝑚𝑎𝑥𝑖𝑚𝑢𝑚−𝑚𝑖𝑛𝑖𝑚𝑢𝑚
3.
2
Amplitude changes and Vertical shifts (the role of 𝒂 and 𝒒) 4. The amplitude for a tan graph is
undefined.
In Grade 10 we studied some transformations of the 3 basic trig functions.
Our transformed functions were defined as:
𝑦 = 𝑎 sin 𝑥 + 𝑞 𝑦 = 𝑎 cos 𝑥 + 𝑞 𝑦 = 𝑎 tan 𝑥 + 𝑞
When the numerical value of 𝑎 increases (ignoring the sign), the amplitude of the sin and cos
graphs increases. The numerical value of 𝑎 determines the steepness of the tan graph.
If 𝑎 is negative, the graphs are all reflected in the 𝑥 axis.
𝑞 shifts the graphs up (𝑞 > 0) or down (𝑞 < 0).
1
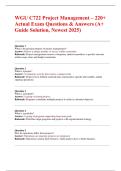
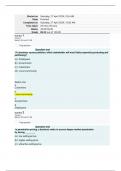
, Worked Example 1: Consider the function 𝑓(𝑥) = 2𝑠𝑖𝑛𝑥 − 1
1. Sketch the graph of 𝑓 for 𝑥 ∈ [0°; 360°].
2. Write down the period and amplitude of 𝑓.
3. Write down the range of 𝑓.
Solution
Thought process:
1. Step 1: Consider the basic shape (sin, cos or tan) Step 2: Consider the stretch (a value)
Start with a basic sin graph, rough sketch 𝑎 = 2. Stretch the graph vertically up to
2 and down to -2.
Step 3: Consider the vertical shift (q value)
𝑞 = −1. The graph is shifted 1 unit down. Think of the 5 critical points (the 3 zeros, the max
and the min) moved down 1 unit each and then joined to give the new sin graph.
NOTE: You may be asked to label all
Turning points and/or ‘end’ points, so you
would label (90°; 1); (270°; −3);
(360° ; −1)
2. Period: 360°
Amplitude: 2
The range is represented by
3. Range: 0 ≤ 𝑦 ≤ −3 or 𝑦 ∈ [−3; 1] 𝑦 ∈ [𝑚𝑖𝑛; 𝑚𝑎𝑥]
2