0
Inferential Statistics test 2 - Unit 550, 553, 554, 560, 561, 563,
510, 545, 548 & 590
Cicely Bullee
Libraries used in R: tidyverse, janitor, ggplot, ggplotExtra, broom, modelr, Rbase,
car, lmtest.
, 1
Unit 550
Key terms:
multiple regression
addition
(analysis of) residuals
Build up and assess a multiple regression model with the additive effect of
variables using R.
Micro lectures
Addition: both independent variables (x1, x2), independently affect your
dependent variable.
- Linear equation: Y = b0 + b2*x2 + b1*x1 (+ε)
- In the example below, x2 is type (dummy), x1 is education (ratio).
- b2 is second because we want to know the intercept, the slope is the same
in addition.
- b2 is the difference between the intercepts of both lines.
- Residuals should be ‘normal’ and ‘equal’, ε is normally distributed.
In multiple regression there are two types of expectations:
1. General expectation (R2 and F-test)
2. Specific expectation (b-coefficients and t-test)
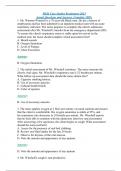
A relationship with a dependent scale variable and
two independent ratio variables, looks
like this:
The blue line is the reference category.
In the linear equation: x2 is in this case
education, x1 is age
, 2
Residuals (ei): in the sample.
Errors (εi): in the population.
We are interested in the residuals in the population, if there are small deviations
in the residuals of a sample this is not necessarily problematic.
Residuals give an indication about how good the estimates (b-coefficients) are.
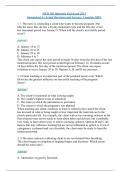
What should residuals look like:
1. The distribution of the residuals should be normal. (All other factors
combined create mere noise).
(Histogram with residuals)
2. The residuals should have the same variance everywhere in the model.
(otherwise, we probably mis specified the model). Residuals should be in a
‘box’.
((scatterplot with residuals (y) +
predictions(x))
Problematic residuals cause (strong effect on the estimates):
1. Non-linearity
2. Other factors play a role too.
Solutions problematic residuals:
1. Change/ ‘reconceptualize’ your variables
2. Change the model/ include extra variables (parabolic or logarithmic)
R Studio
When adding a dummy variable in an lm(), put as.factor in front of it. (So R knows
it’s a dummy and not simply the numbers 1 or 0).
In summary model: (Ho: likely these data are from a population in which there is
NO linear association between Y and the associated variables).
Check your data!! Filter out any n/a or 999 numbers.
Inferential Statistics test 2 - Unit 550, 553, 554, 560, 561, 563,
510, 545, 548 & 590
Cicely Bullee
Libraries used in R: tidyverse, janitor, ggplot, ggplotExtra, broom, modelr, Rbase,
car, lmtest.
, 1
Unit 550
Key terms:
multiple regression
addition
(analysis of) residuals
Build up and assess a multiple regression model with the additive effect of
variables using R.
Micro lectures
Addition: both independent variables (x1, x2), independently affect your
dependent variable.
- Linear equation: Y = b0 + b2*x2 + b1*x1 (+ε)
- In the example below, x2 is type (dummy), x1 is education (ratio).
- b2 is second because we want to know the intercept, the slope is the same
in addition.
- b2 is the difference between the intercepts of both lines.
- Residuals should be ‘normal’ and ‘equal’, ε is normally distributed.
In multiple regression there are two types of expectations:
1. General expectation (R2 and F-test)
2. Specific expectation (b-coefficients and t-test)
A relationship with a dependent scale variable and
two independent ratio variables, looks
like this:
The blue line is the reference category.
In the linear equation: x2 is in this case
education, x1 is age
, 2
Residuals (ei): in the sample.
Errors (εi): in the population.
We are interested in the residuals in the population, if there are small deviations
in the residuals of a sample this is not necessarily problematic.
Residuals give an indication about how good the estimates (b-coefficients) are.
What should residuals look like:
1. The distribution of the residuals should be normal. (All other factors
combined create mere noise).
(Histogram with residuals)
2. The residuals should have the same variance everywhere in the model.
(otherwise, we probably mis specified the model). Residuals should be in a
‘box’.
((scatterplot with residuals (y) +
predictions(x))
Problematic residuals cause (strong effect on the estimates):
1. Non-linearity
2. Other factors play a role too.
Solutions problematic residuals:
1. Change/ ‘reconceptualize’ your variables
2. Change the model/ include extra variables (parabolic or logarithmic)
R Studio
When adding a dummy variable in an lm(), put as.factor in front of it. (So R knows
it’s a dummy and not simply the numbers 1 or 0).
In summary model: (Ho: likely these data are from a population in which there is
NO linear association between Y and the associated variables).
Check your data!! Filter out any n/a or 999 numbers.